ROCO feature updates - October 2026
Senne Van Baelen3 min read
Until now, you mostly read ROCO. In October we worked on acting in it: when ROCO flags a problem, you can pick it up, pass it on or say it doesn’t matter to you. ROCO also shows what the problem costs, so you know what to fix first.
Making your main dashboard actionable
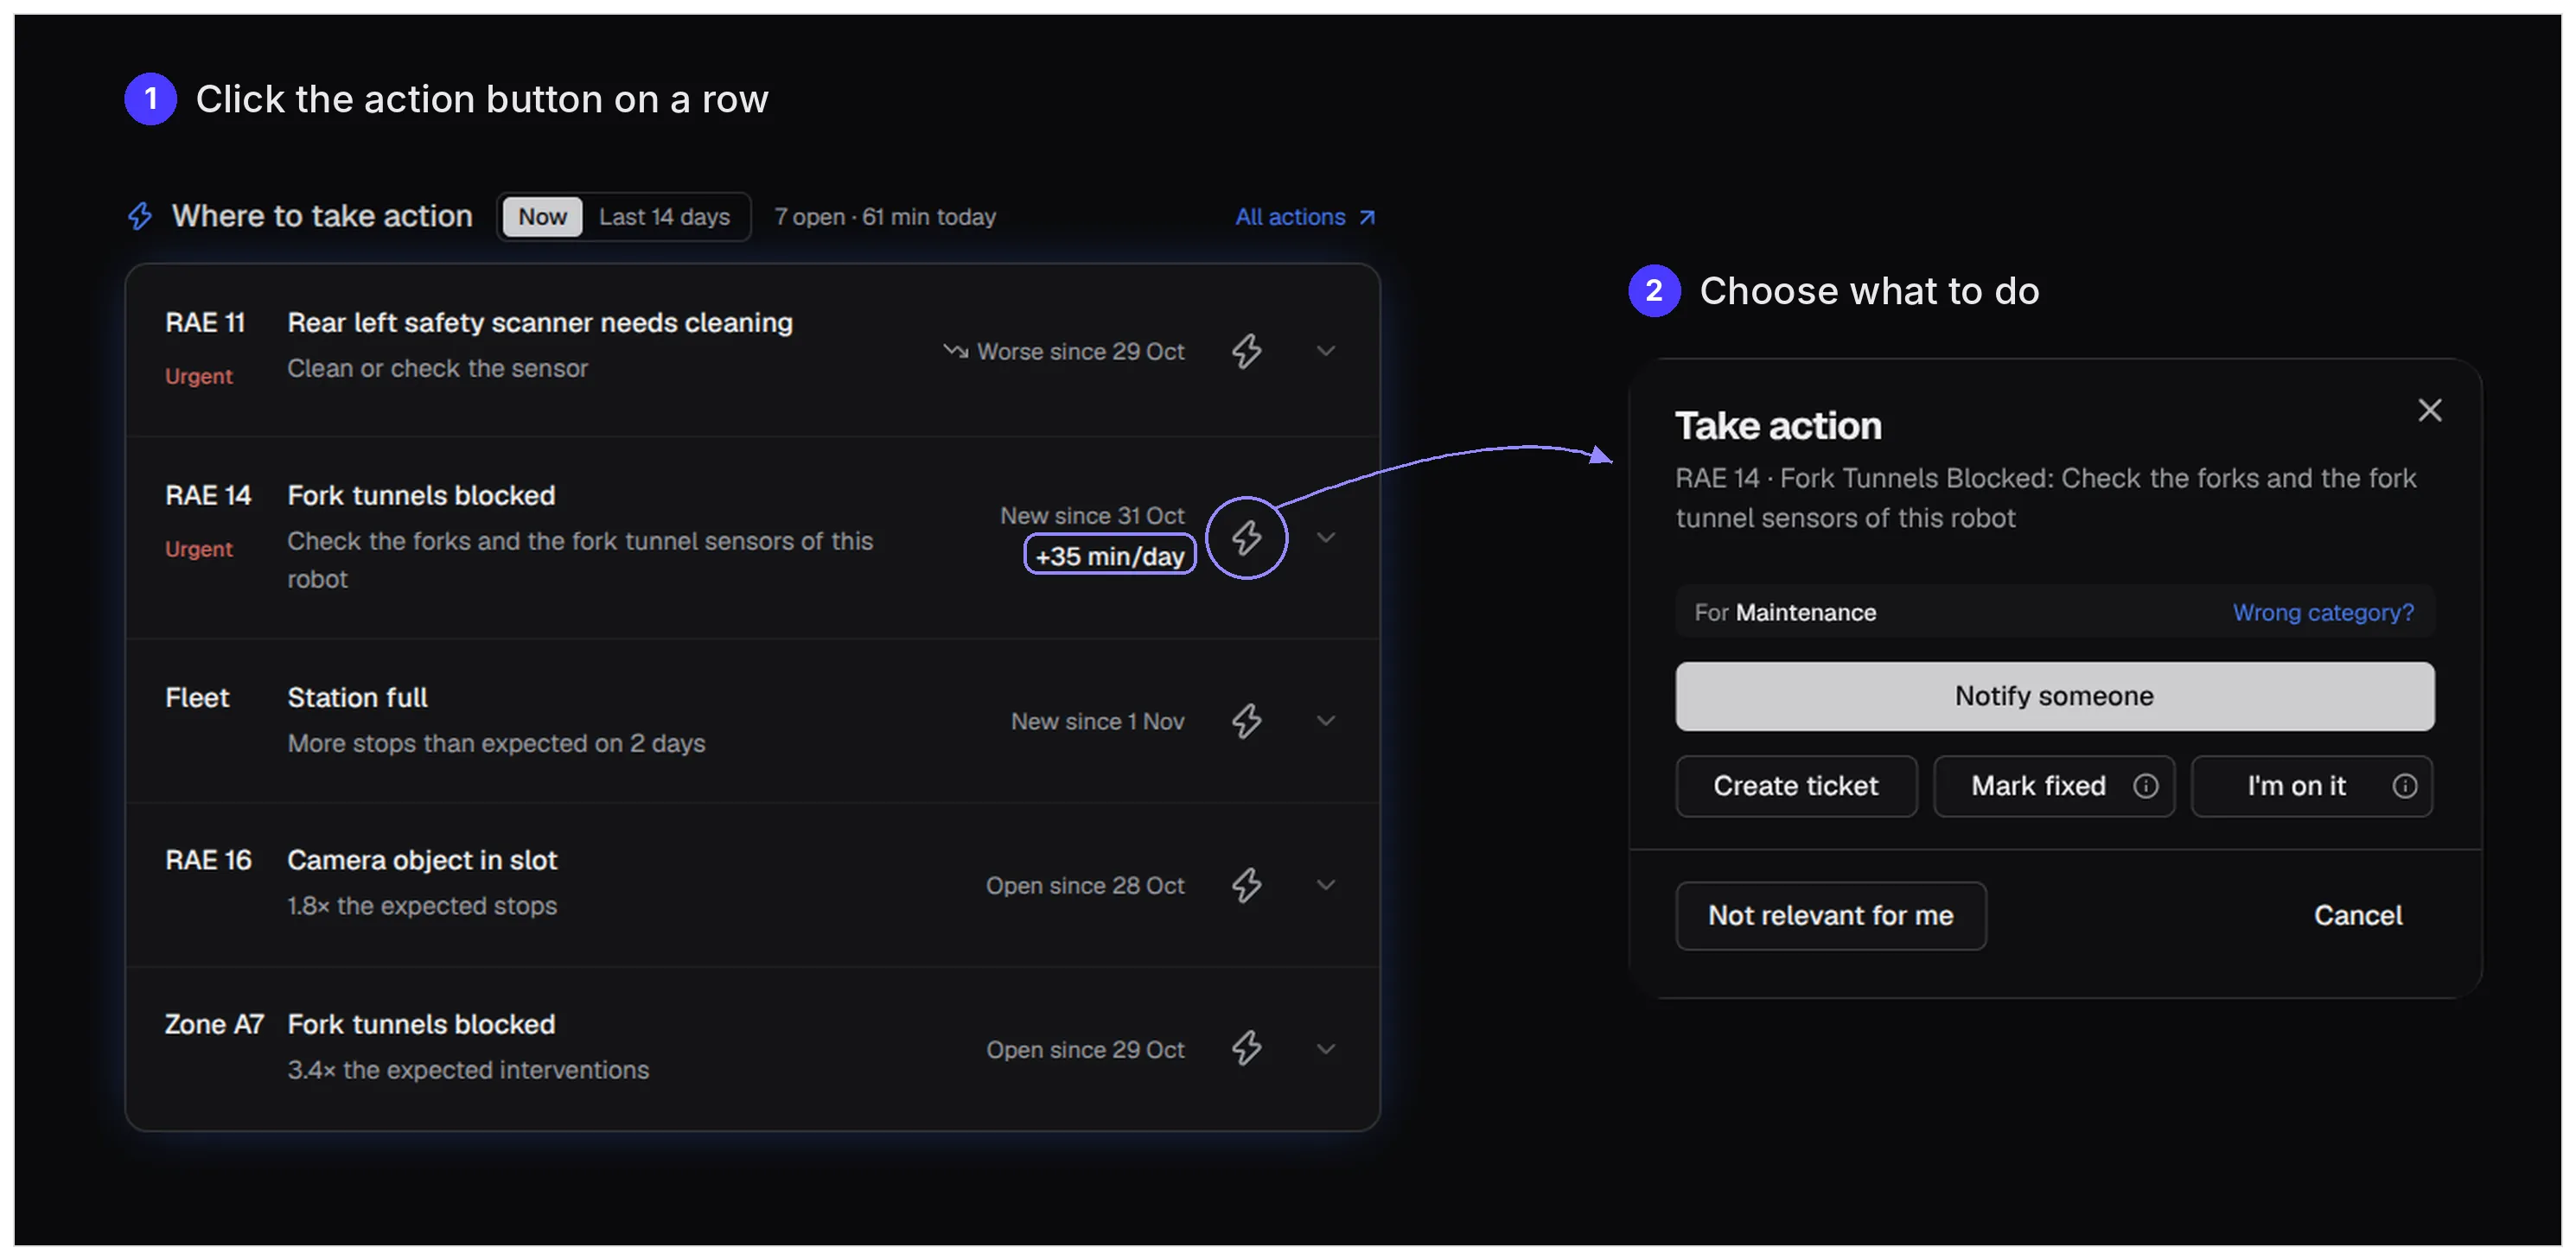
Your main dashboard lists what needs attention on this shift. Each row now has a Take action button to notify someone, create a ticket, mark it fixed or say you’re on it. Not relevant for you? Then the row leaves your list until it gets worse. You can also group robots that need the same fix, such as “Safety scanner needs cleaning, 4 robots, 2 urgent”.
When a problem stops robots, ROCO also computes its impact: the time it costs above what’s normal for your site. “+35 min/day” on one robot’s blocked fork tunnels tells you what a fix can win back. Together with the urgency, that tells you what to fix first.
Every click also tells us something: who picks up what, and what doesn’t matter to whom. That way, the more people use it, the better we can get the right actions to the right people.
Personalizing your actions
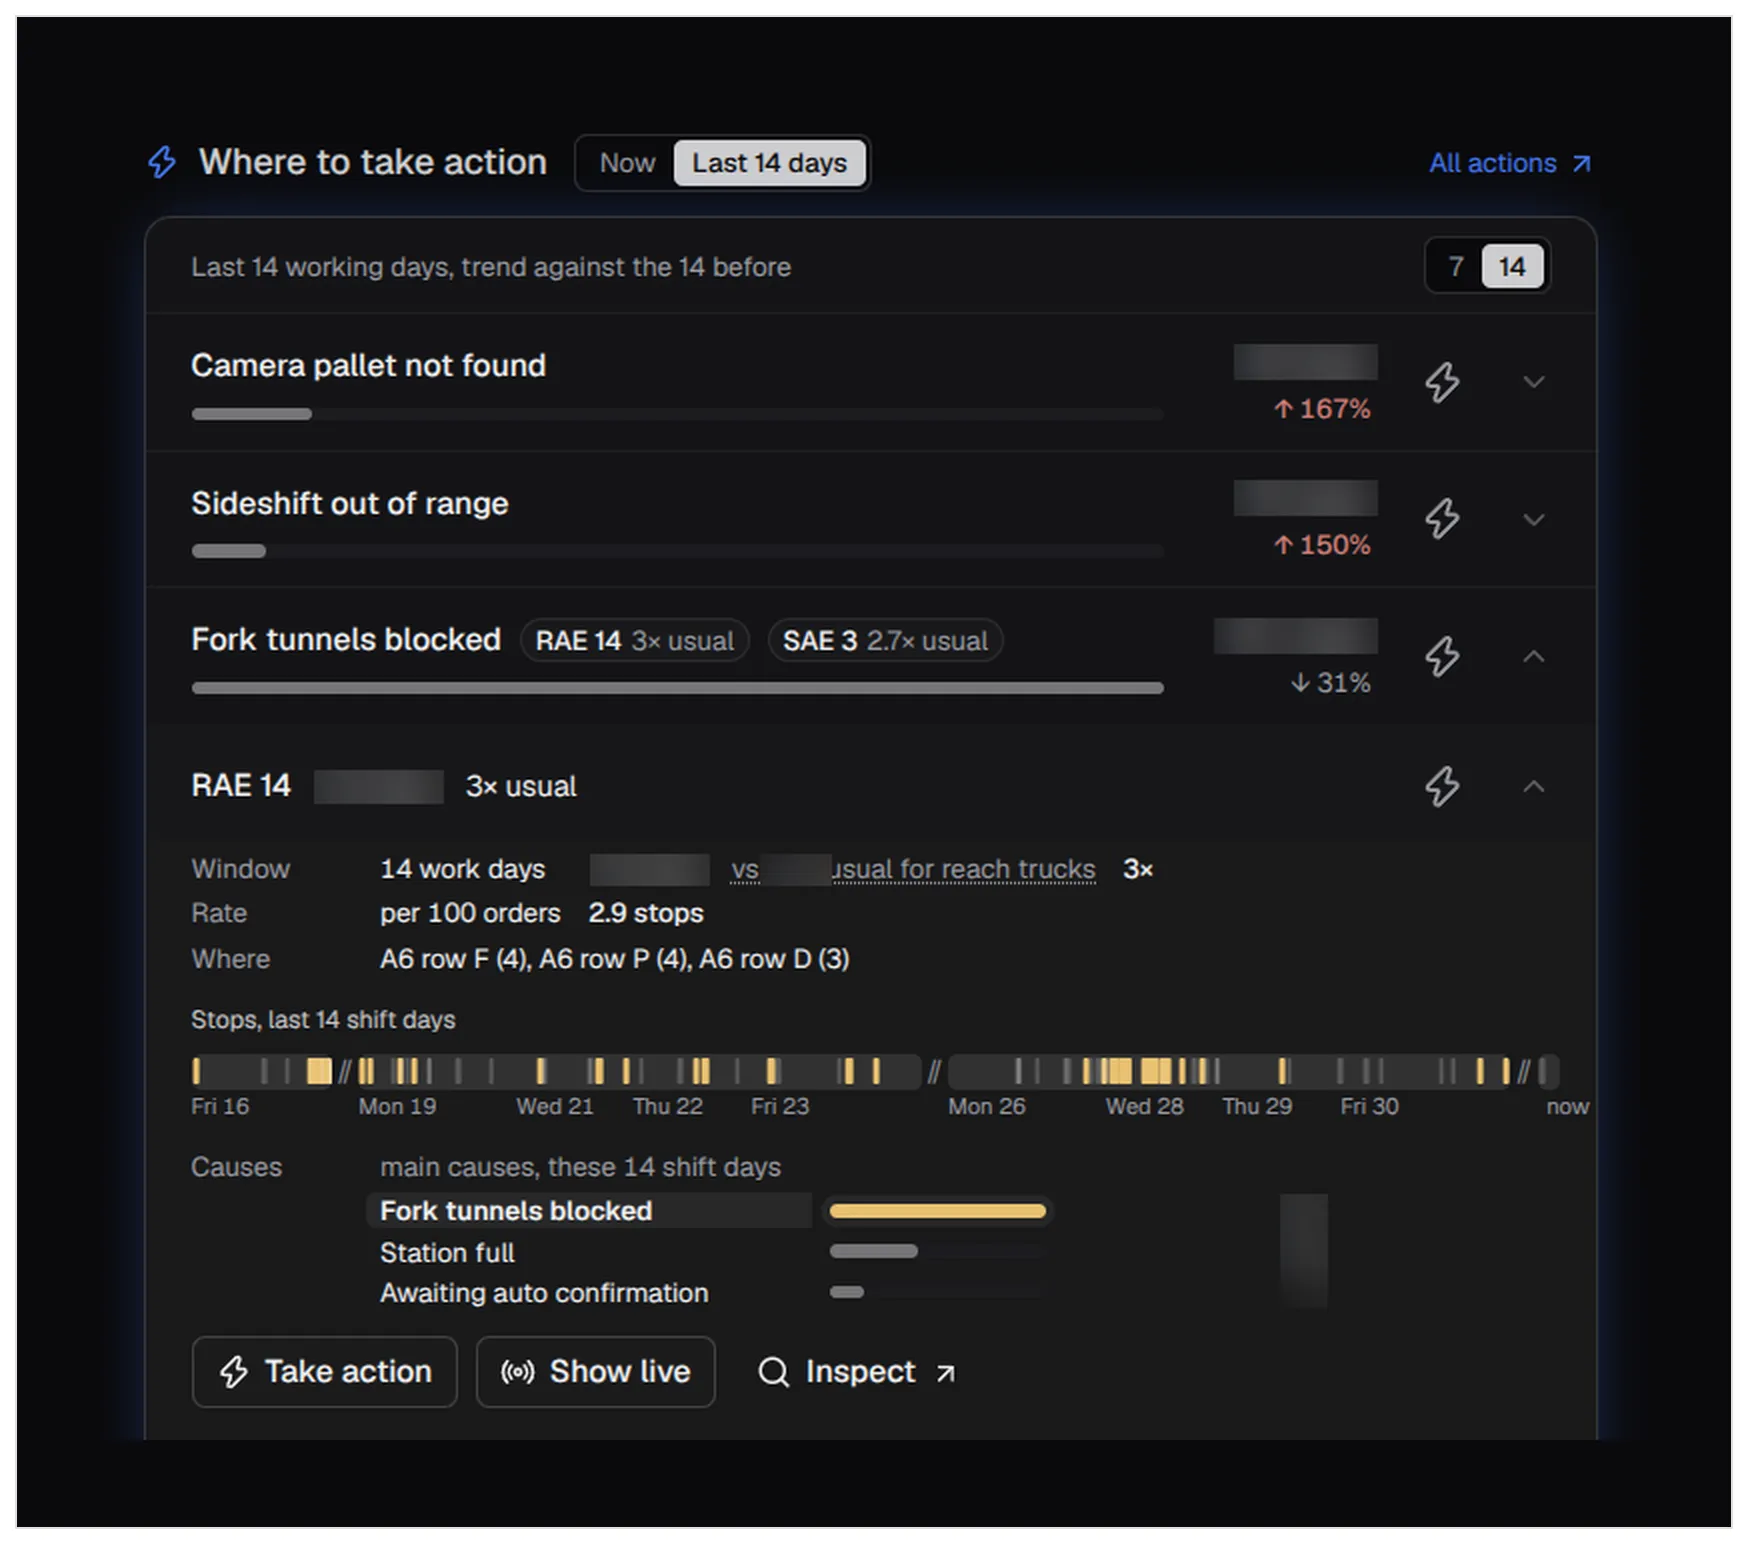
An operator on shift wants to know which robot has a sensor to clean right now. A service engineer wants to know what keeps stopping robots, such as fork tunnels that keep getting blocked, so it can be fixed for good. That’s why the same card now has two views: Now and Last 14 days.
Last 14 days shows what stopped the robots, with the trend against the 14 days before. It also names the robots that stand out from others of their type, such as “3× usual”. Open a robot to see when it stopped, where, and what else stopped it.
Visualizing warehouse patterns
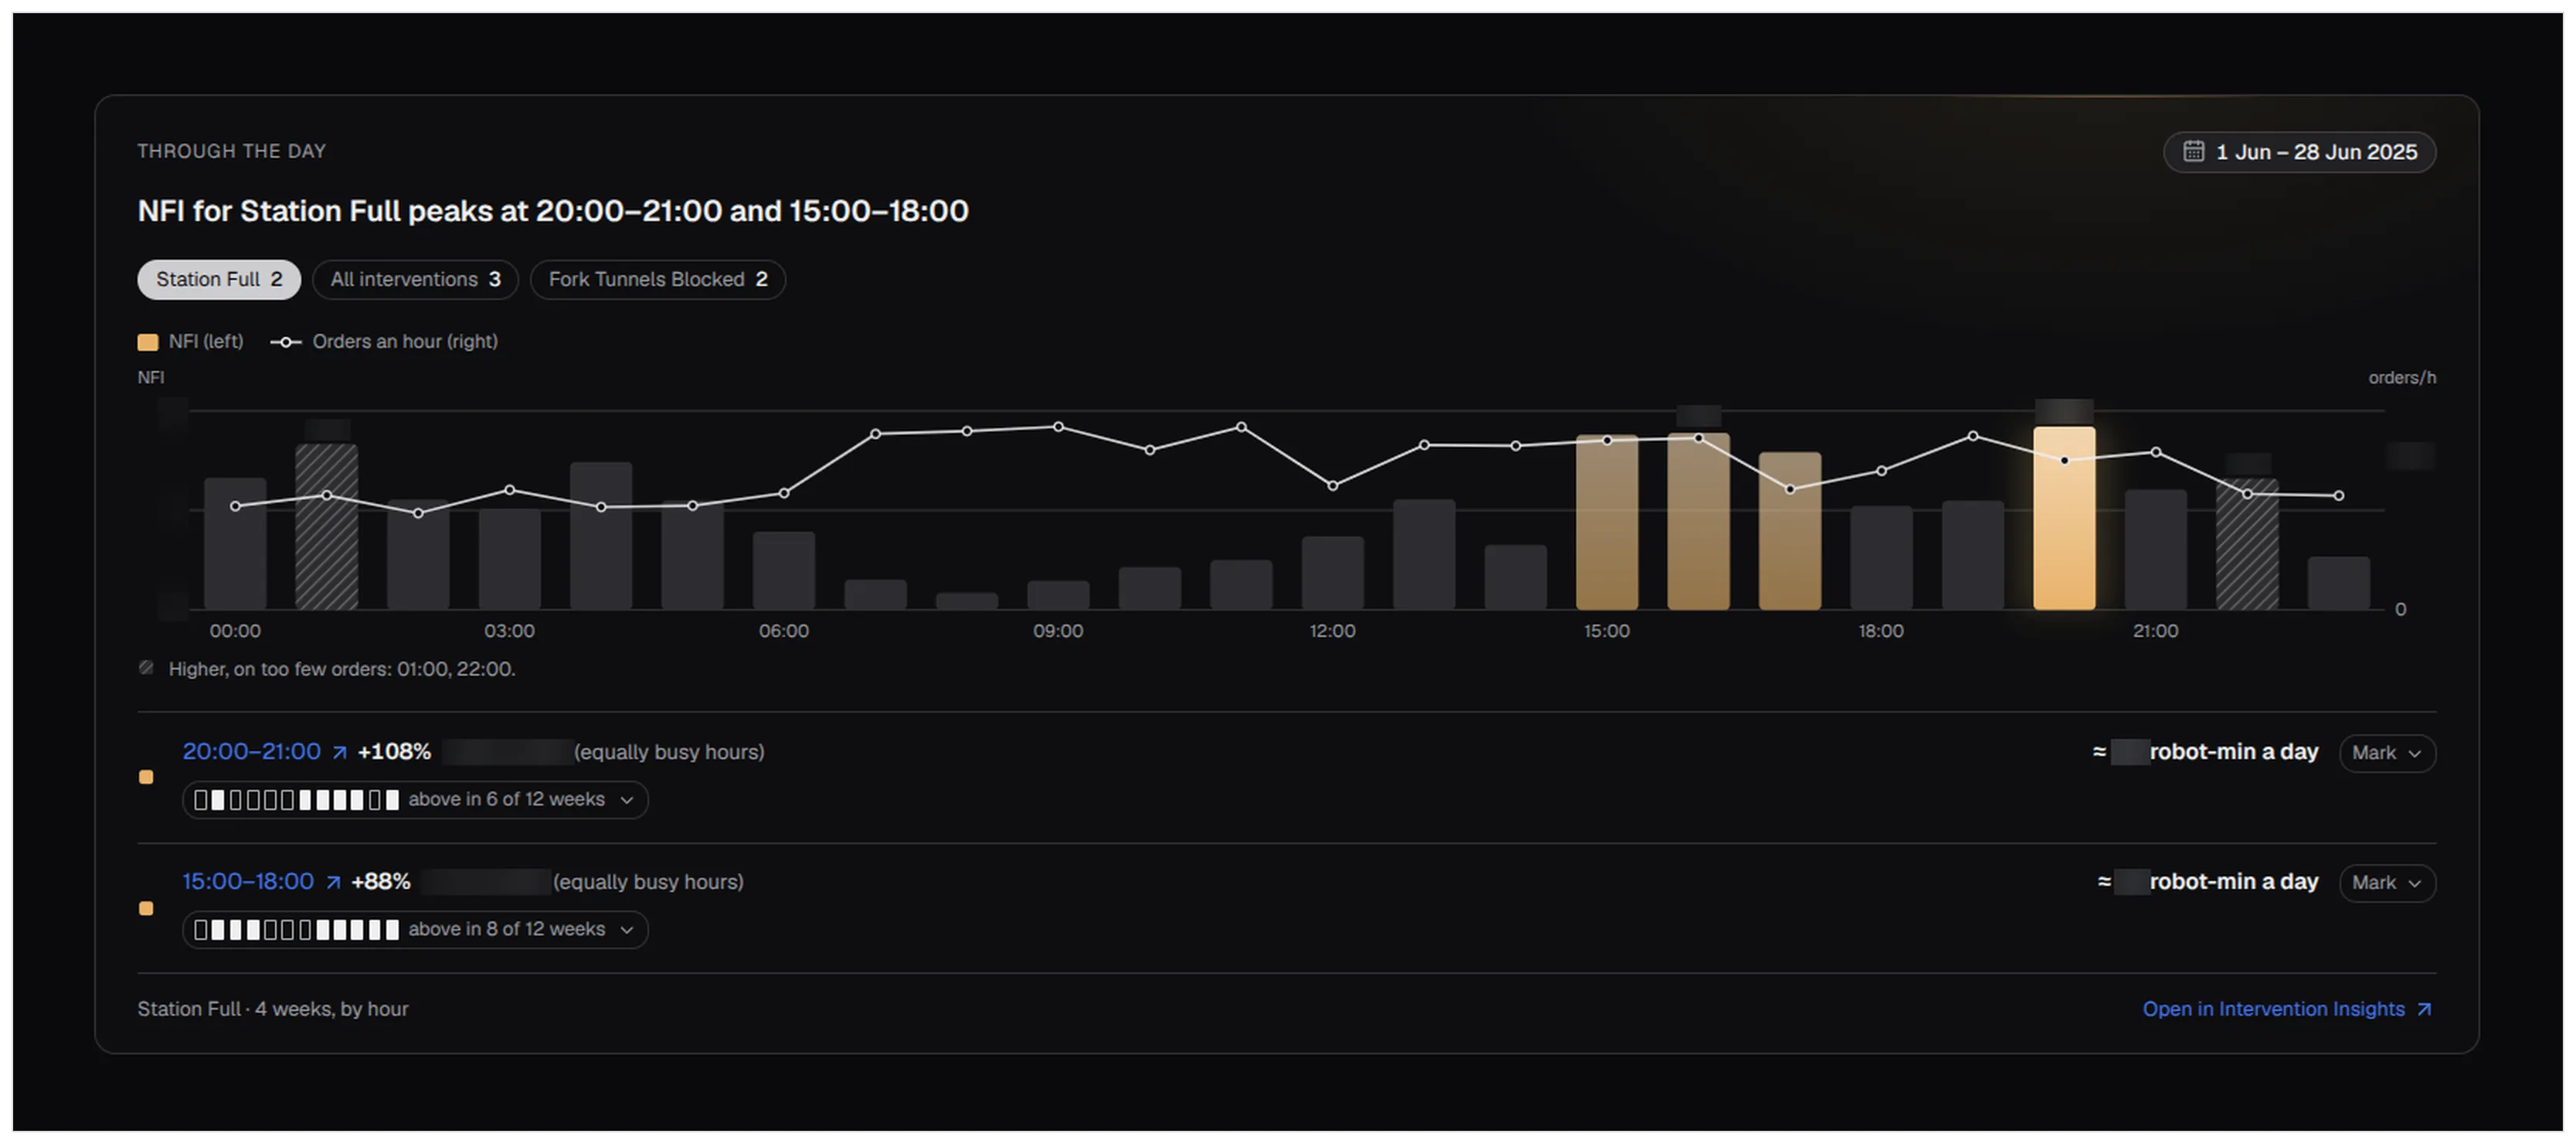
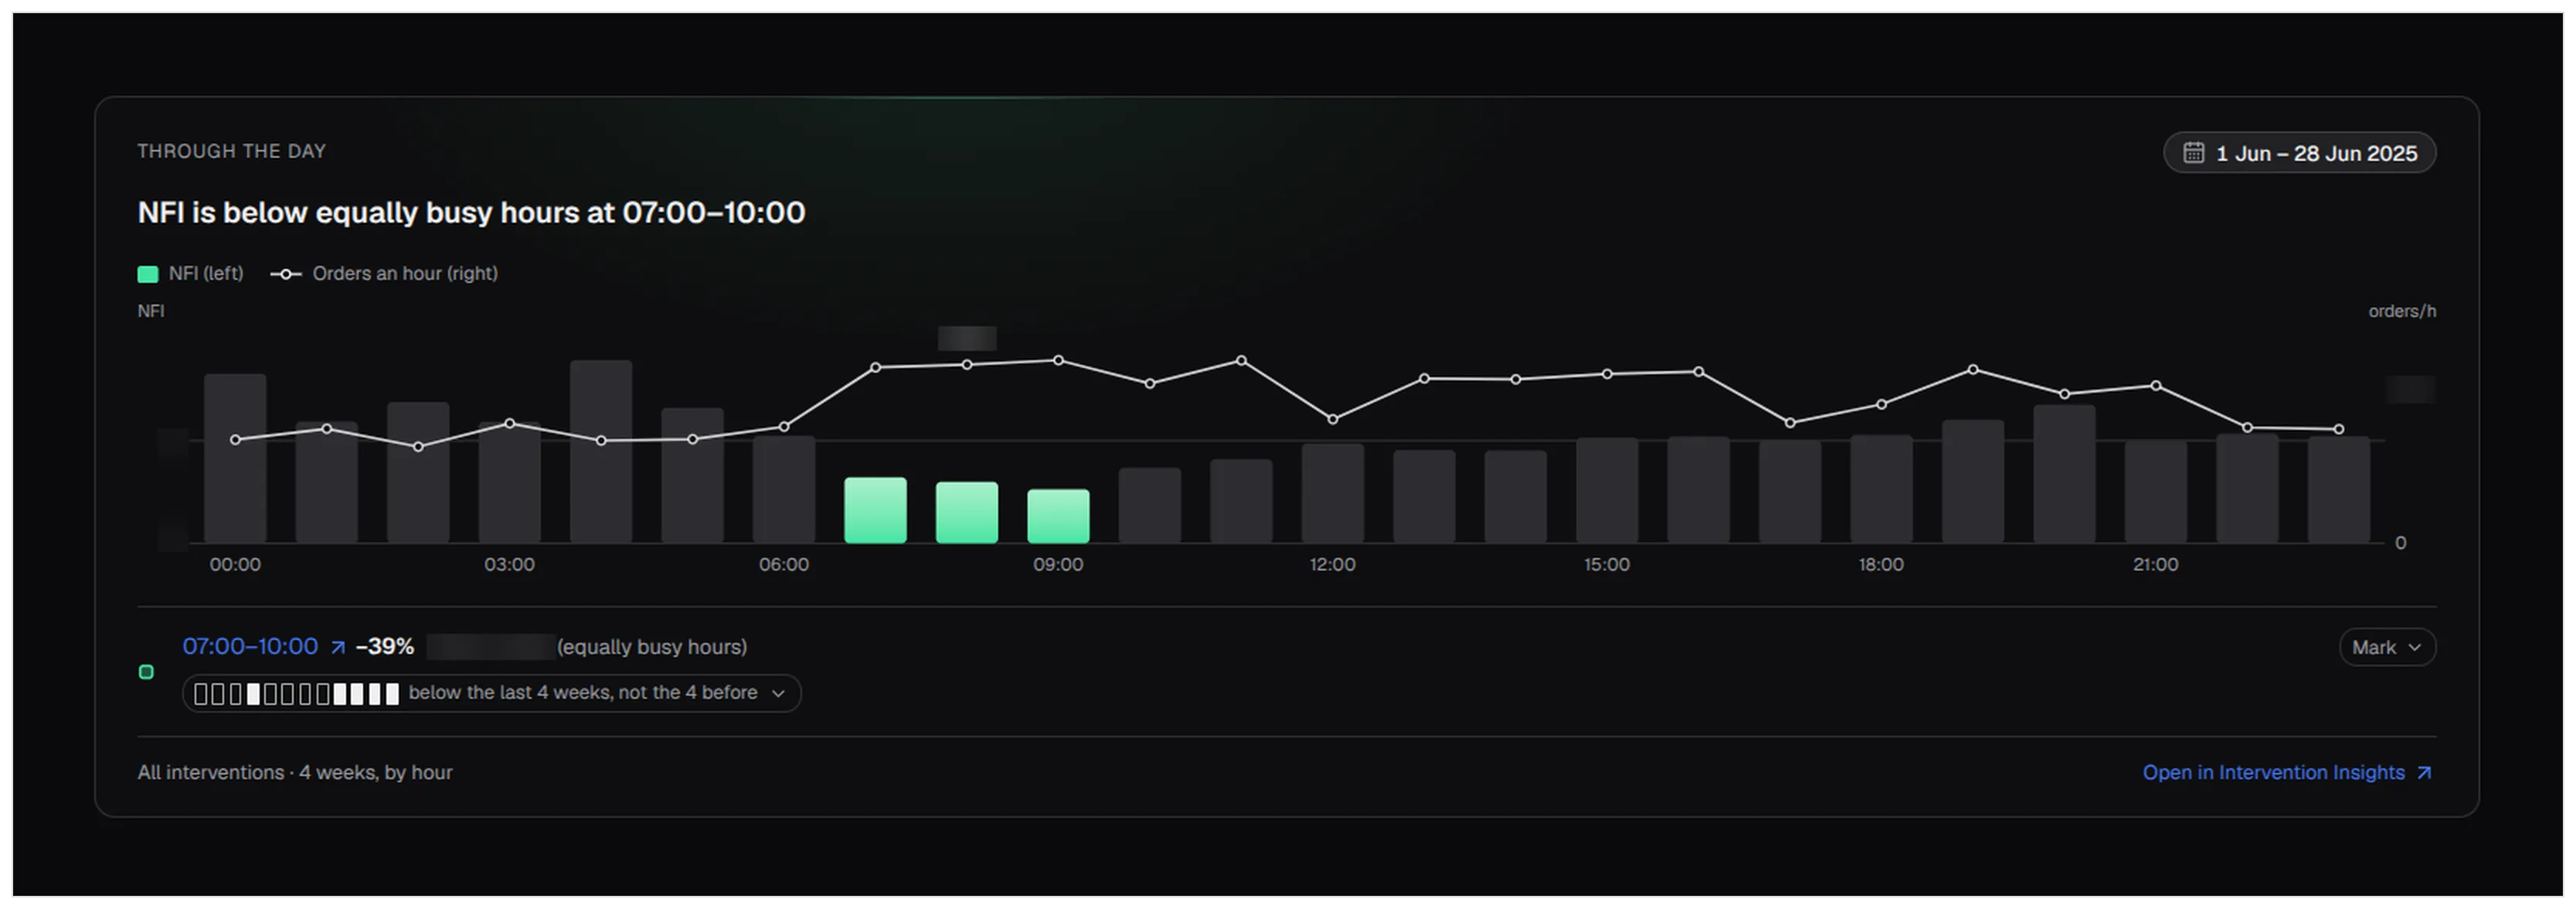
Warehouse patterns now has one chart per question: through the day, through a shift, through the week. Switch between shifts, days, weeks, months and quarters to see the patterns at that scale. Findings come in three kinds. The charts below use NFI, the number of interventions per 100 orders.
What costs time. Each hour is compared with equally busy hours, so an hour doesn’t stand out only because it’s busy. Here, stops for a full station run 88% above equally busy hours from 15:00 to 18:00.
What goes well. From 07:00 to 10:00, NFI is 39% below equally busy hours.
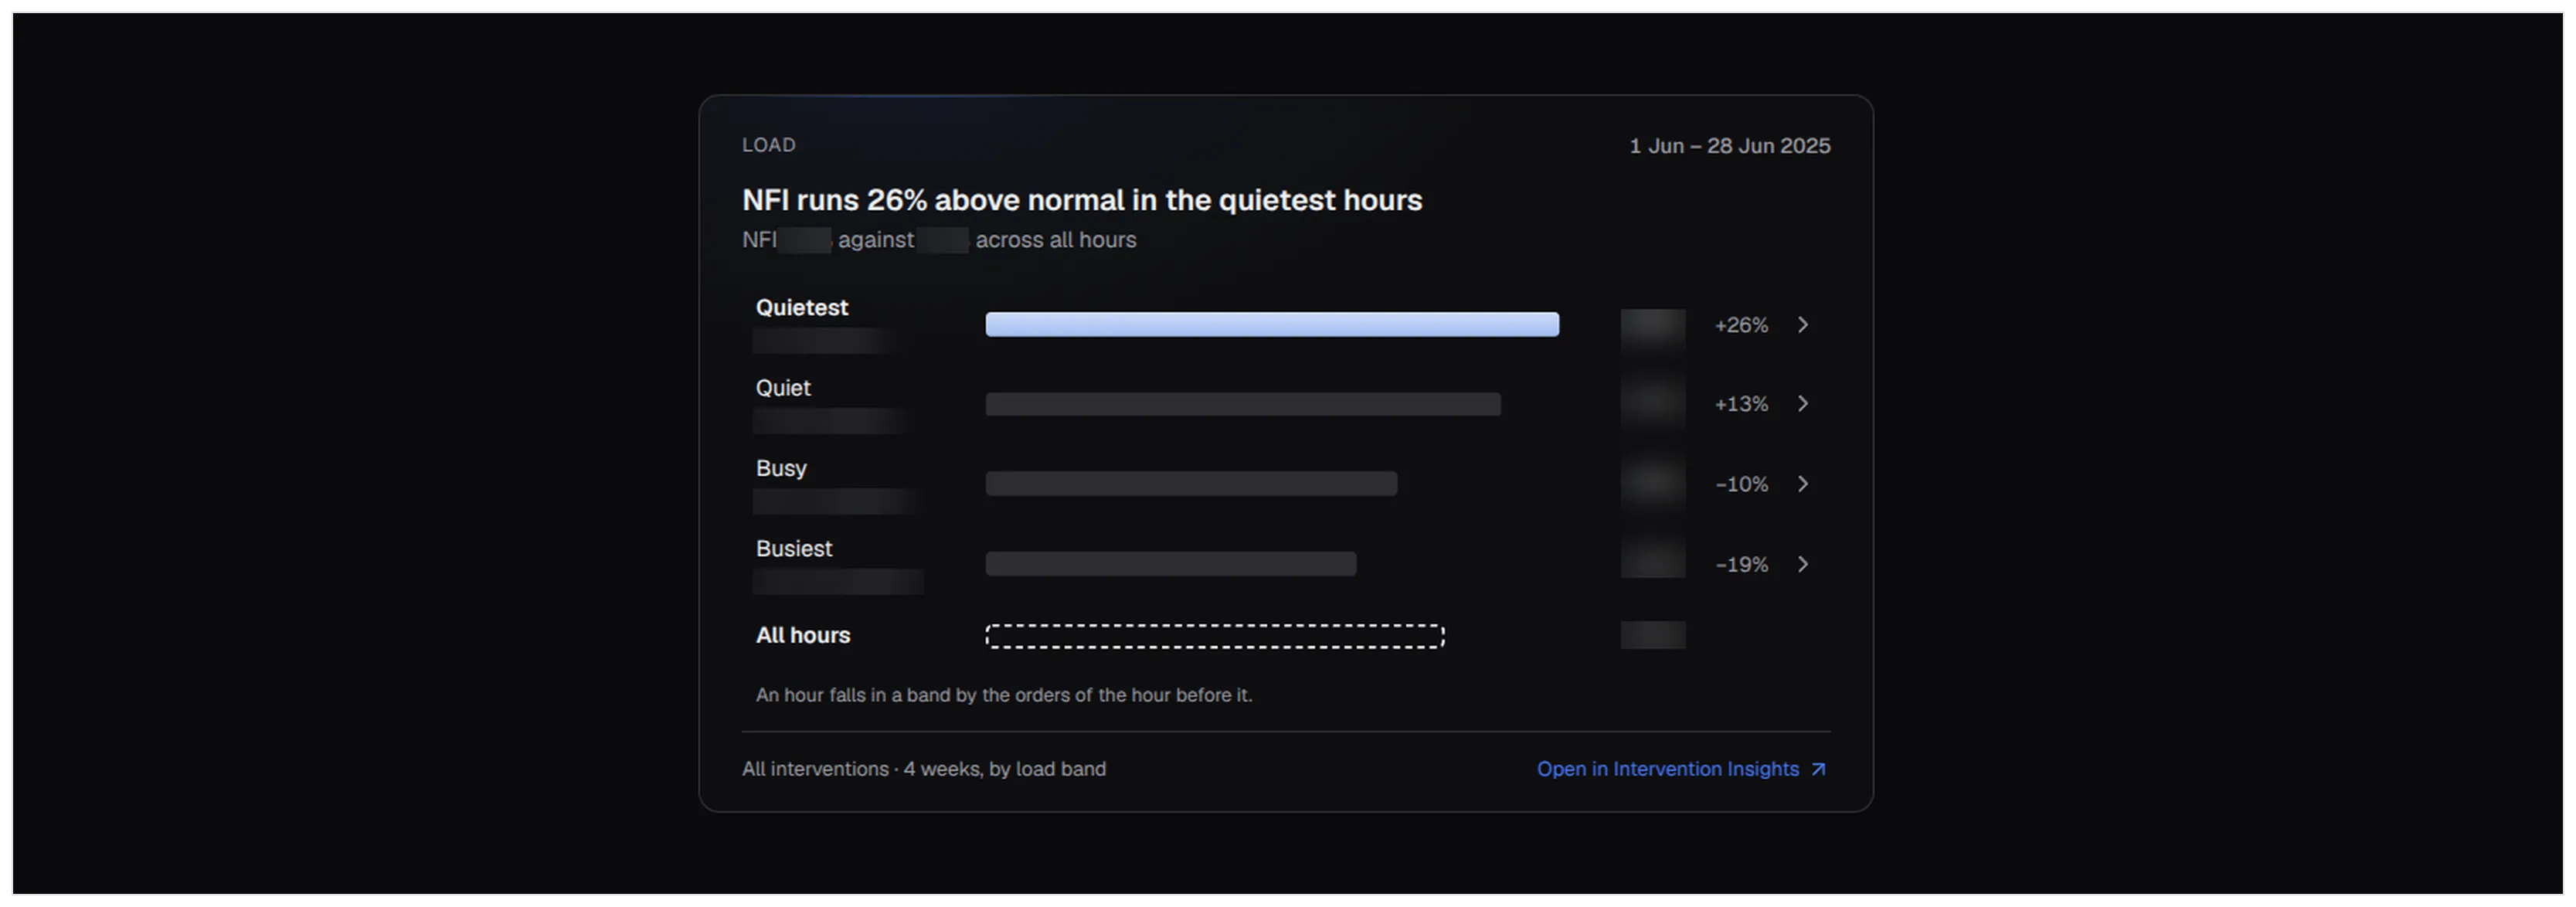
Facts. The quietest hours have the highest NFI, 26% above the average across all hours.
Follow the journey of your load
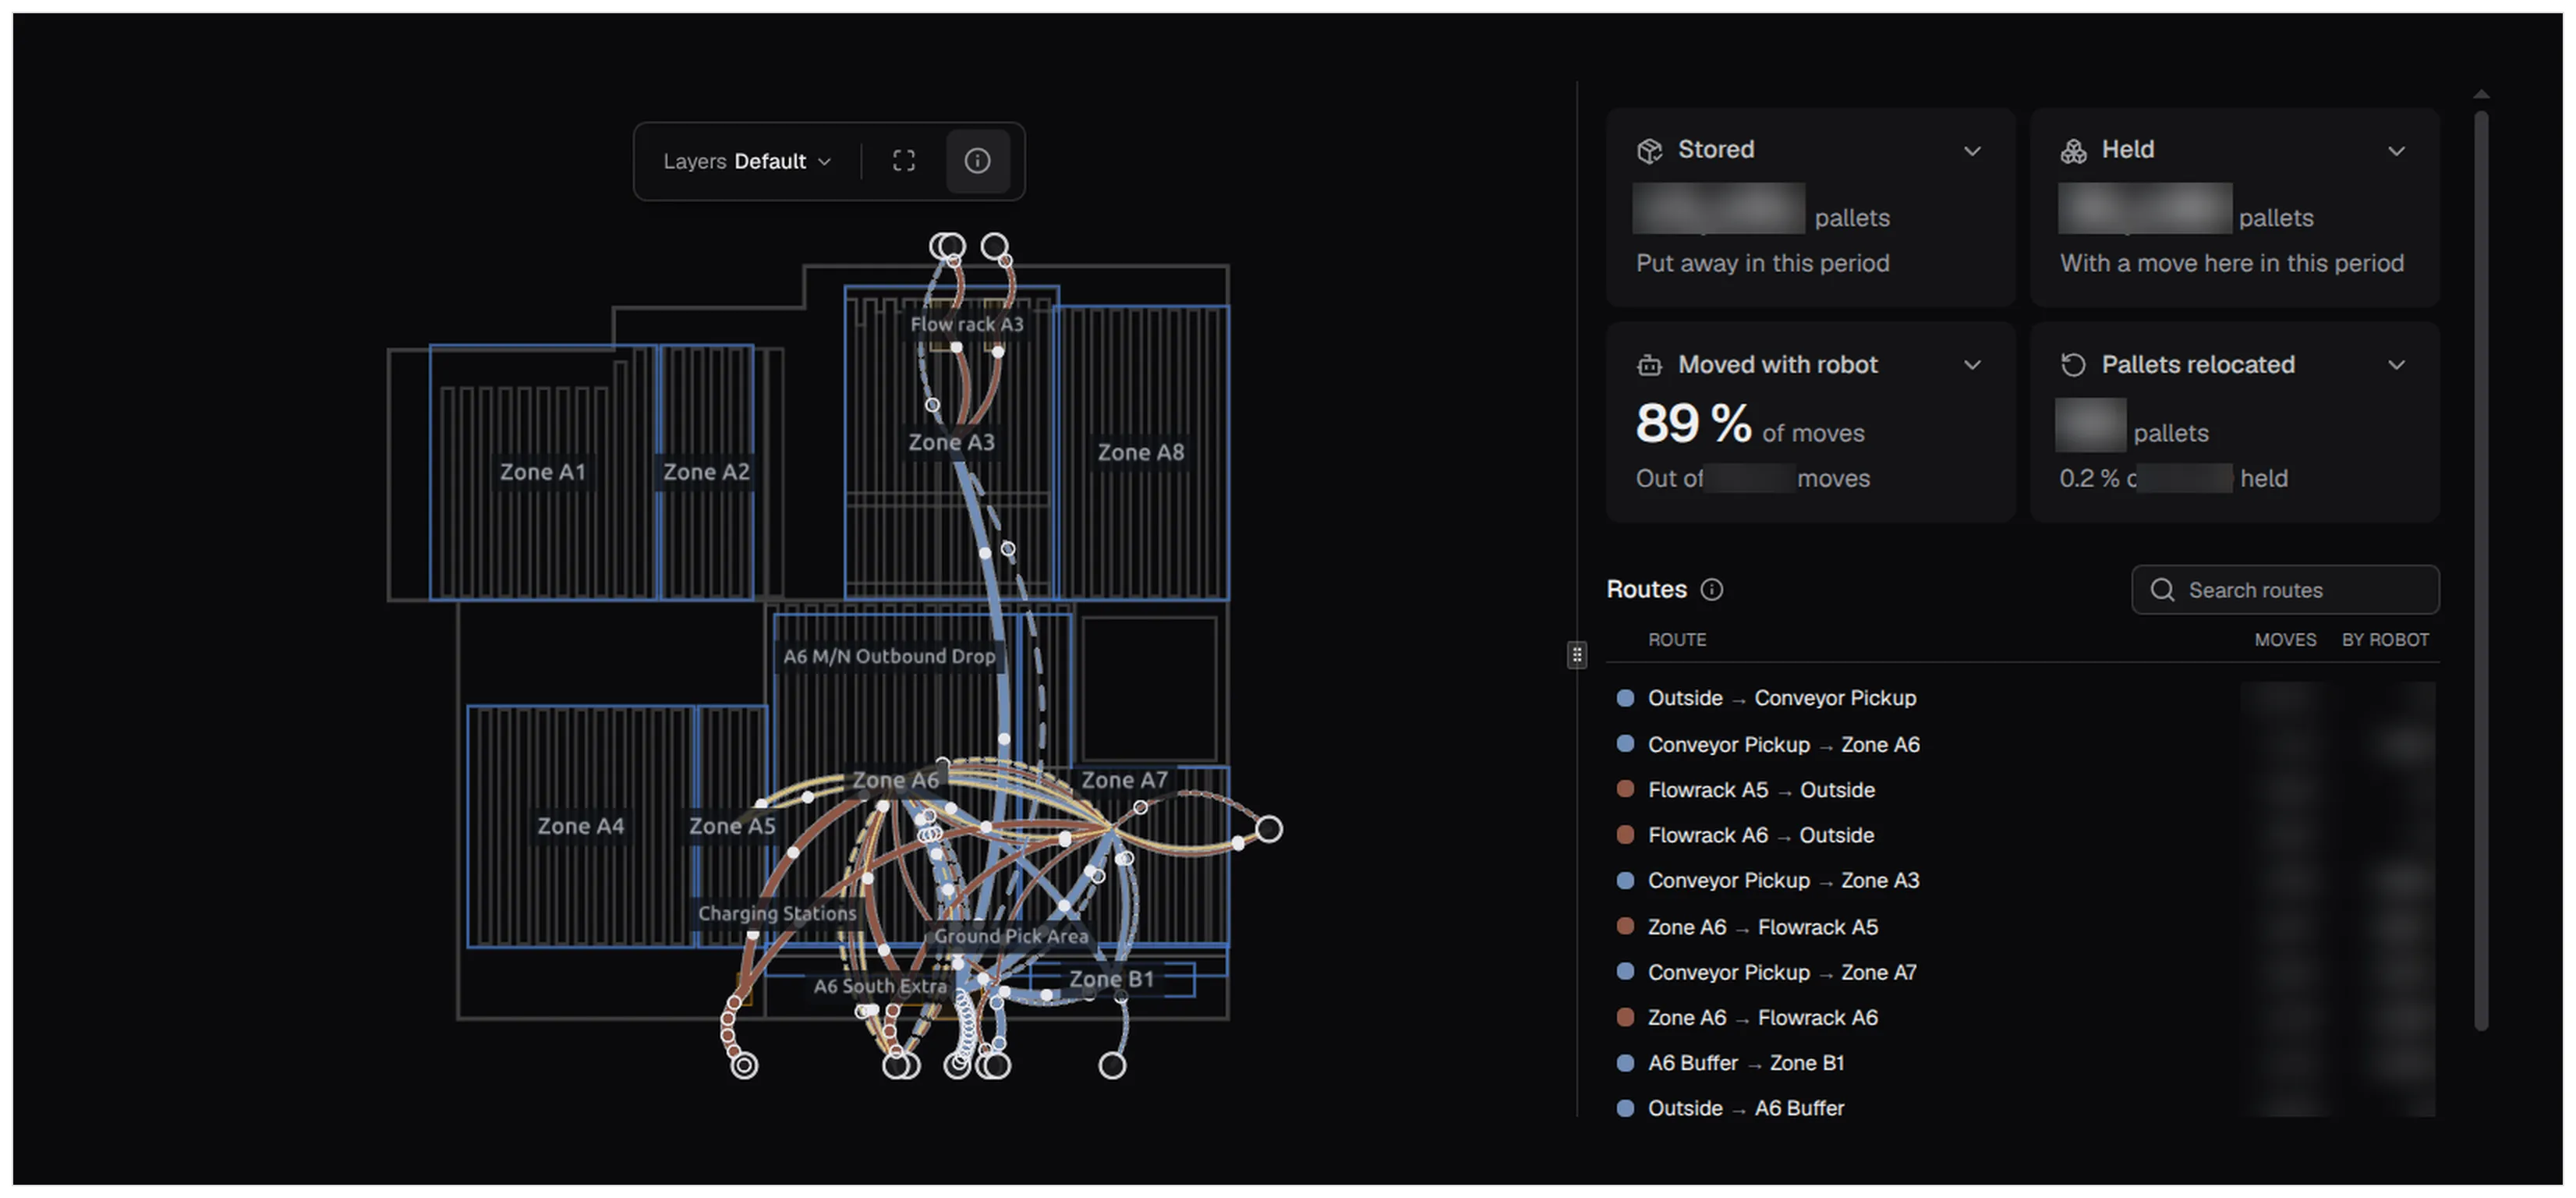
Load tracking shows how your pallets move through the warehouse, and what that says about your operation: which routes are busiest, which share of the moves the robots do, and how many pallets go back on an inbound order after they were stored. You can look it up at every level:
- Per route: its pallets, how long they’ve been on site, how many moves they took, the share done by robots and the interventions on the way.
- Per customer or zone: the pallets stored and held there.
- Per load: search for a pallet by its SSCC, the number on its shipping label.
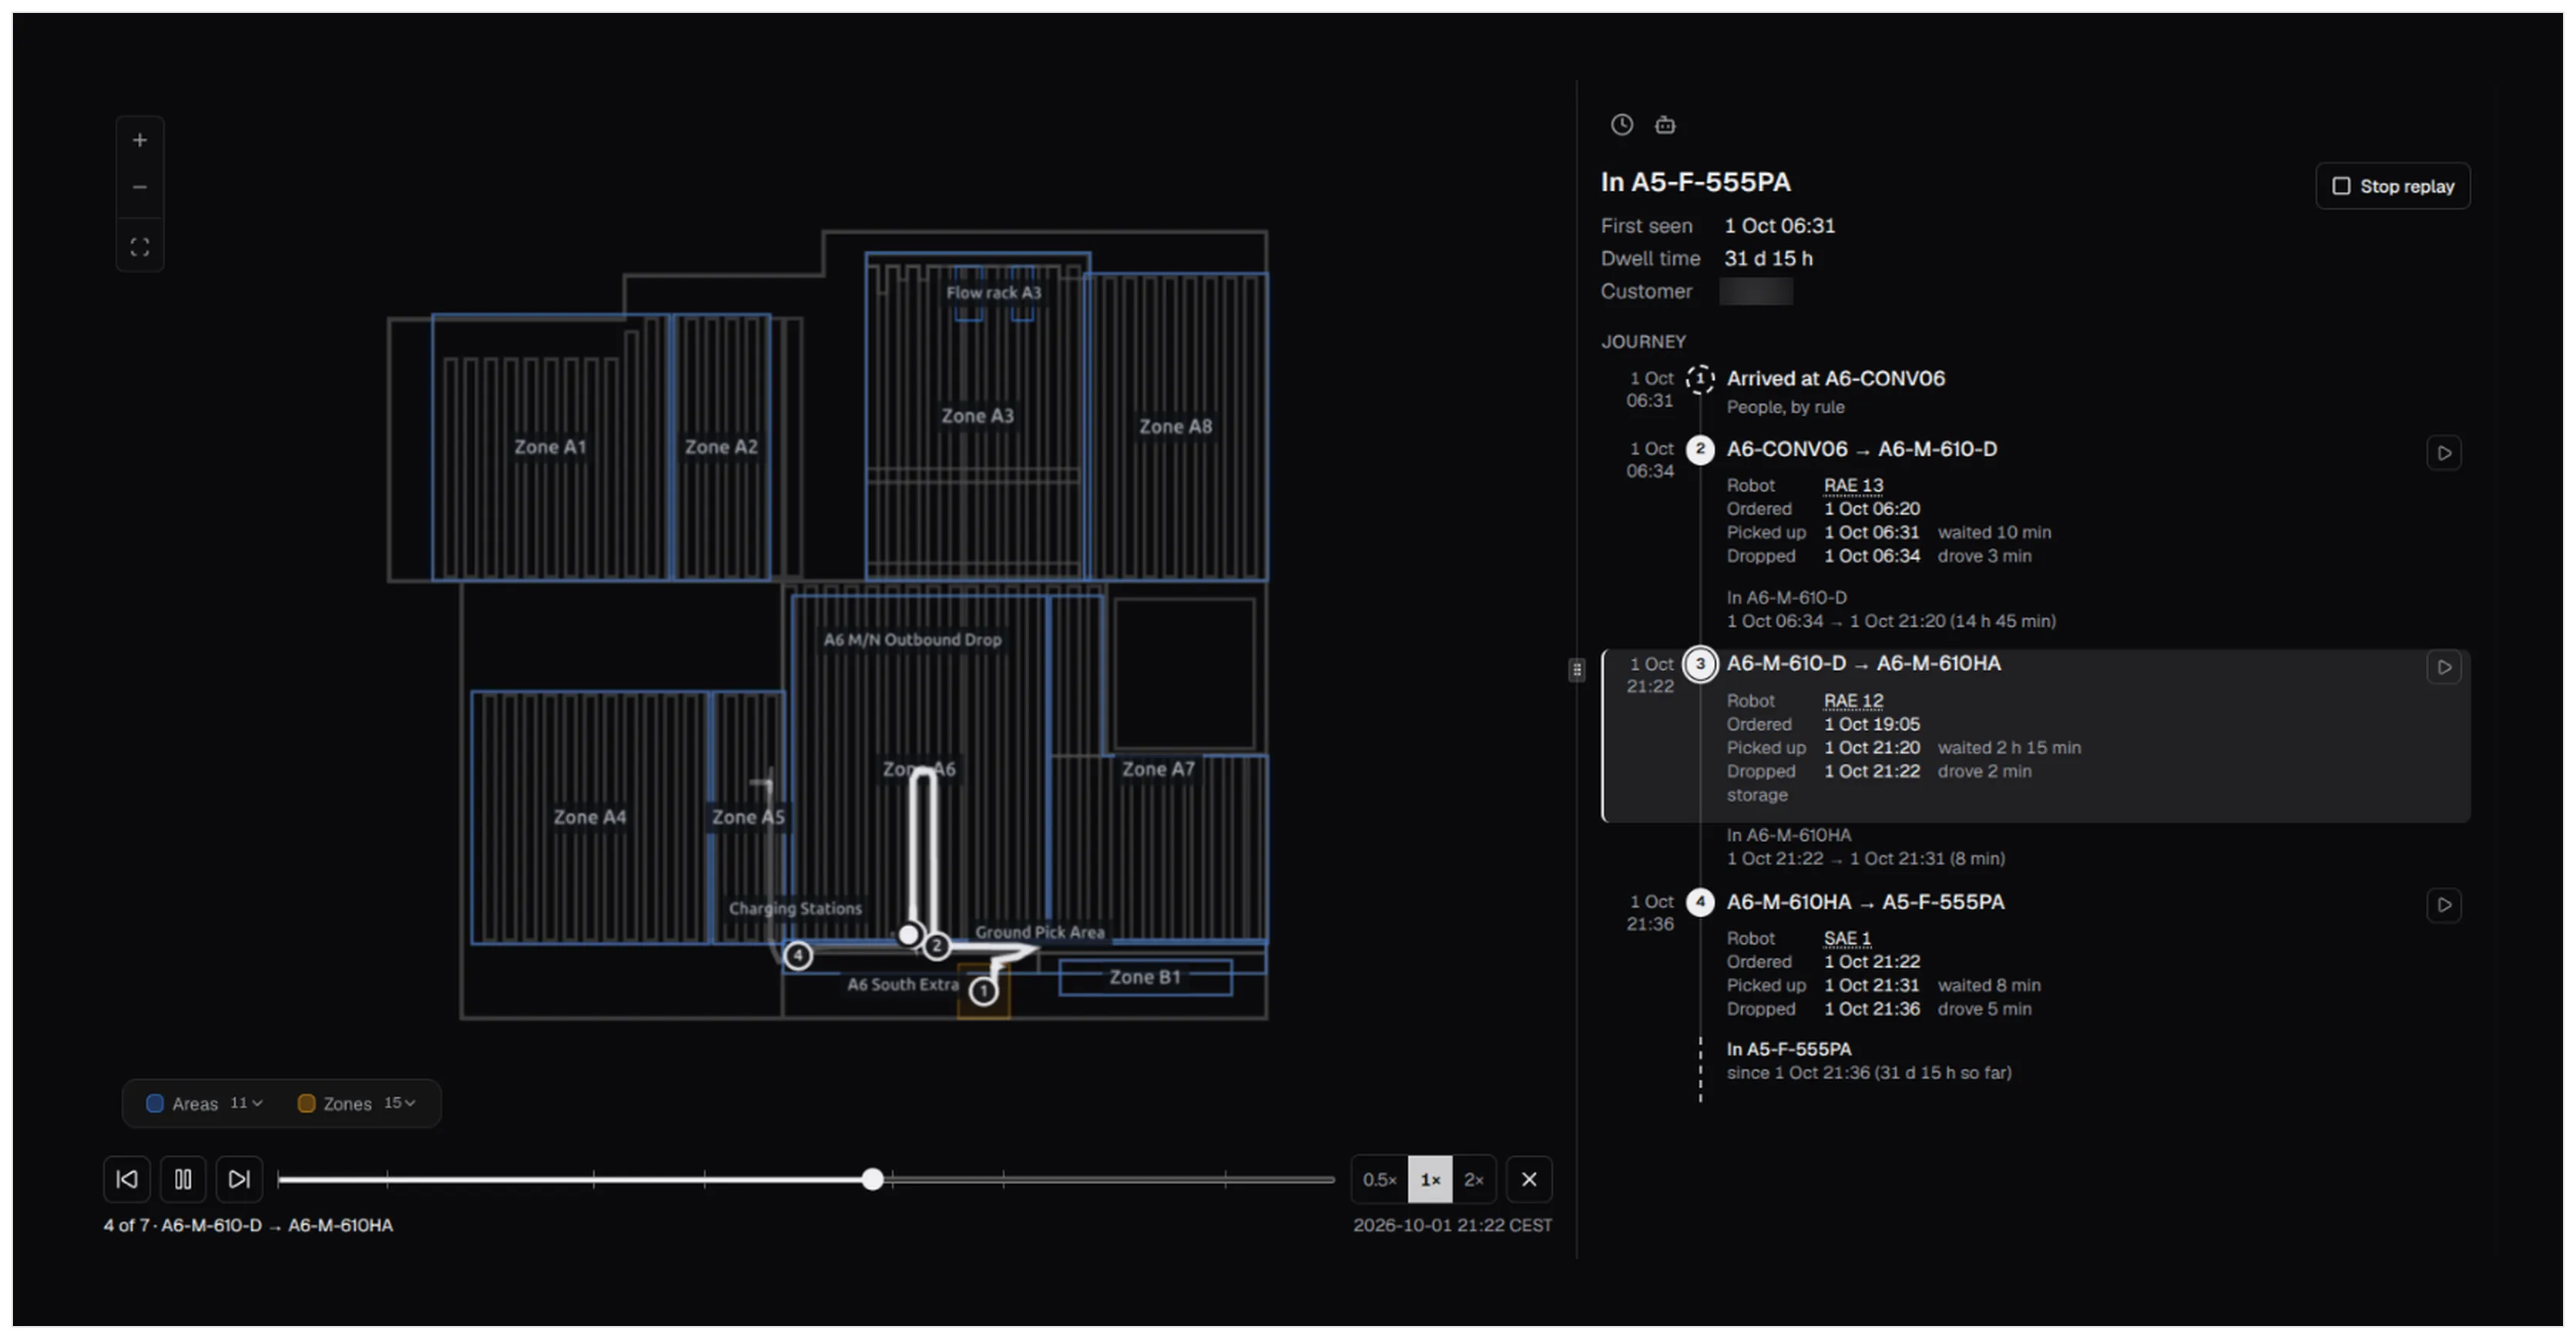
A load’s journey shows where it arrived, which robot moved it, how long it waited for a pickup and where it is now. You can replay it on the map.
Events with impact straight in your mailbox
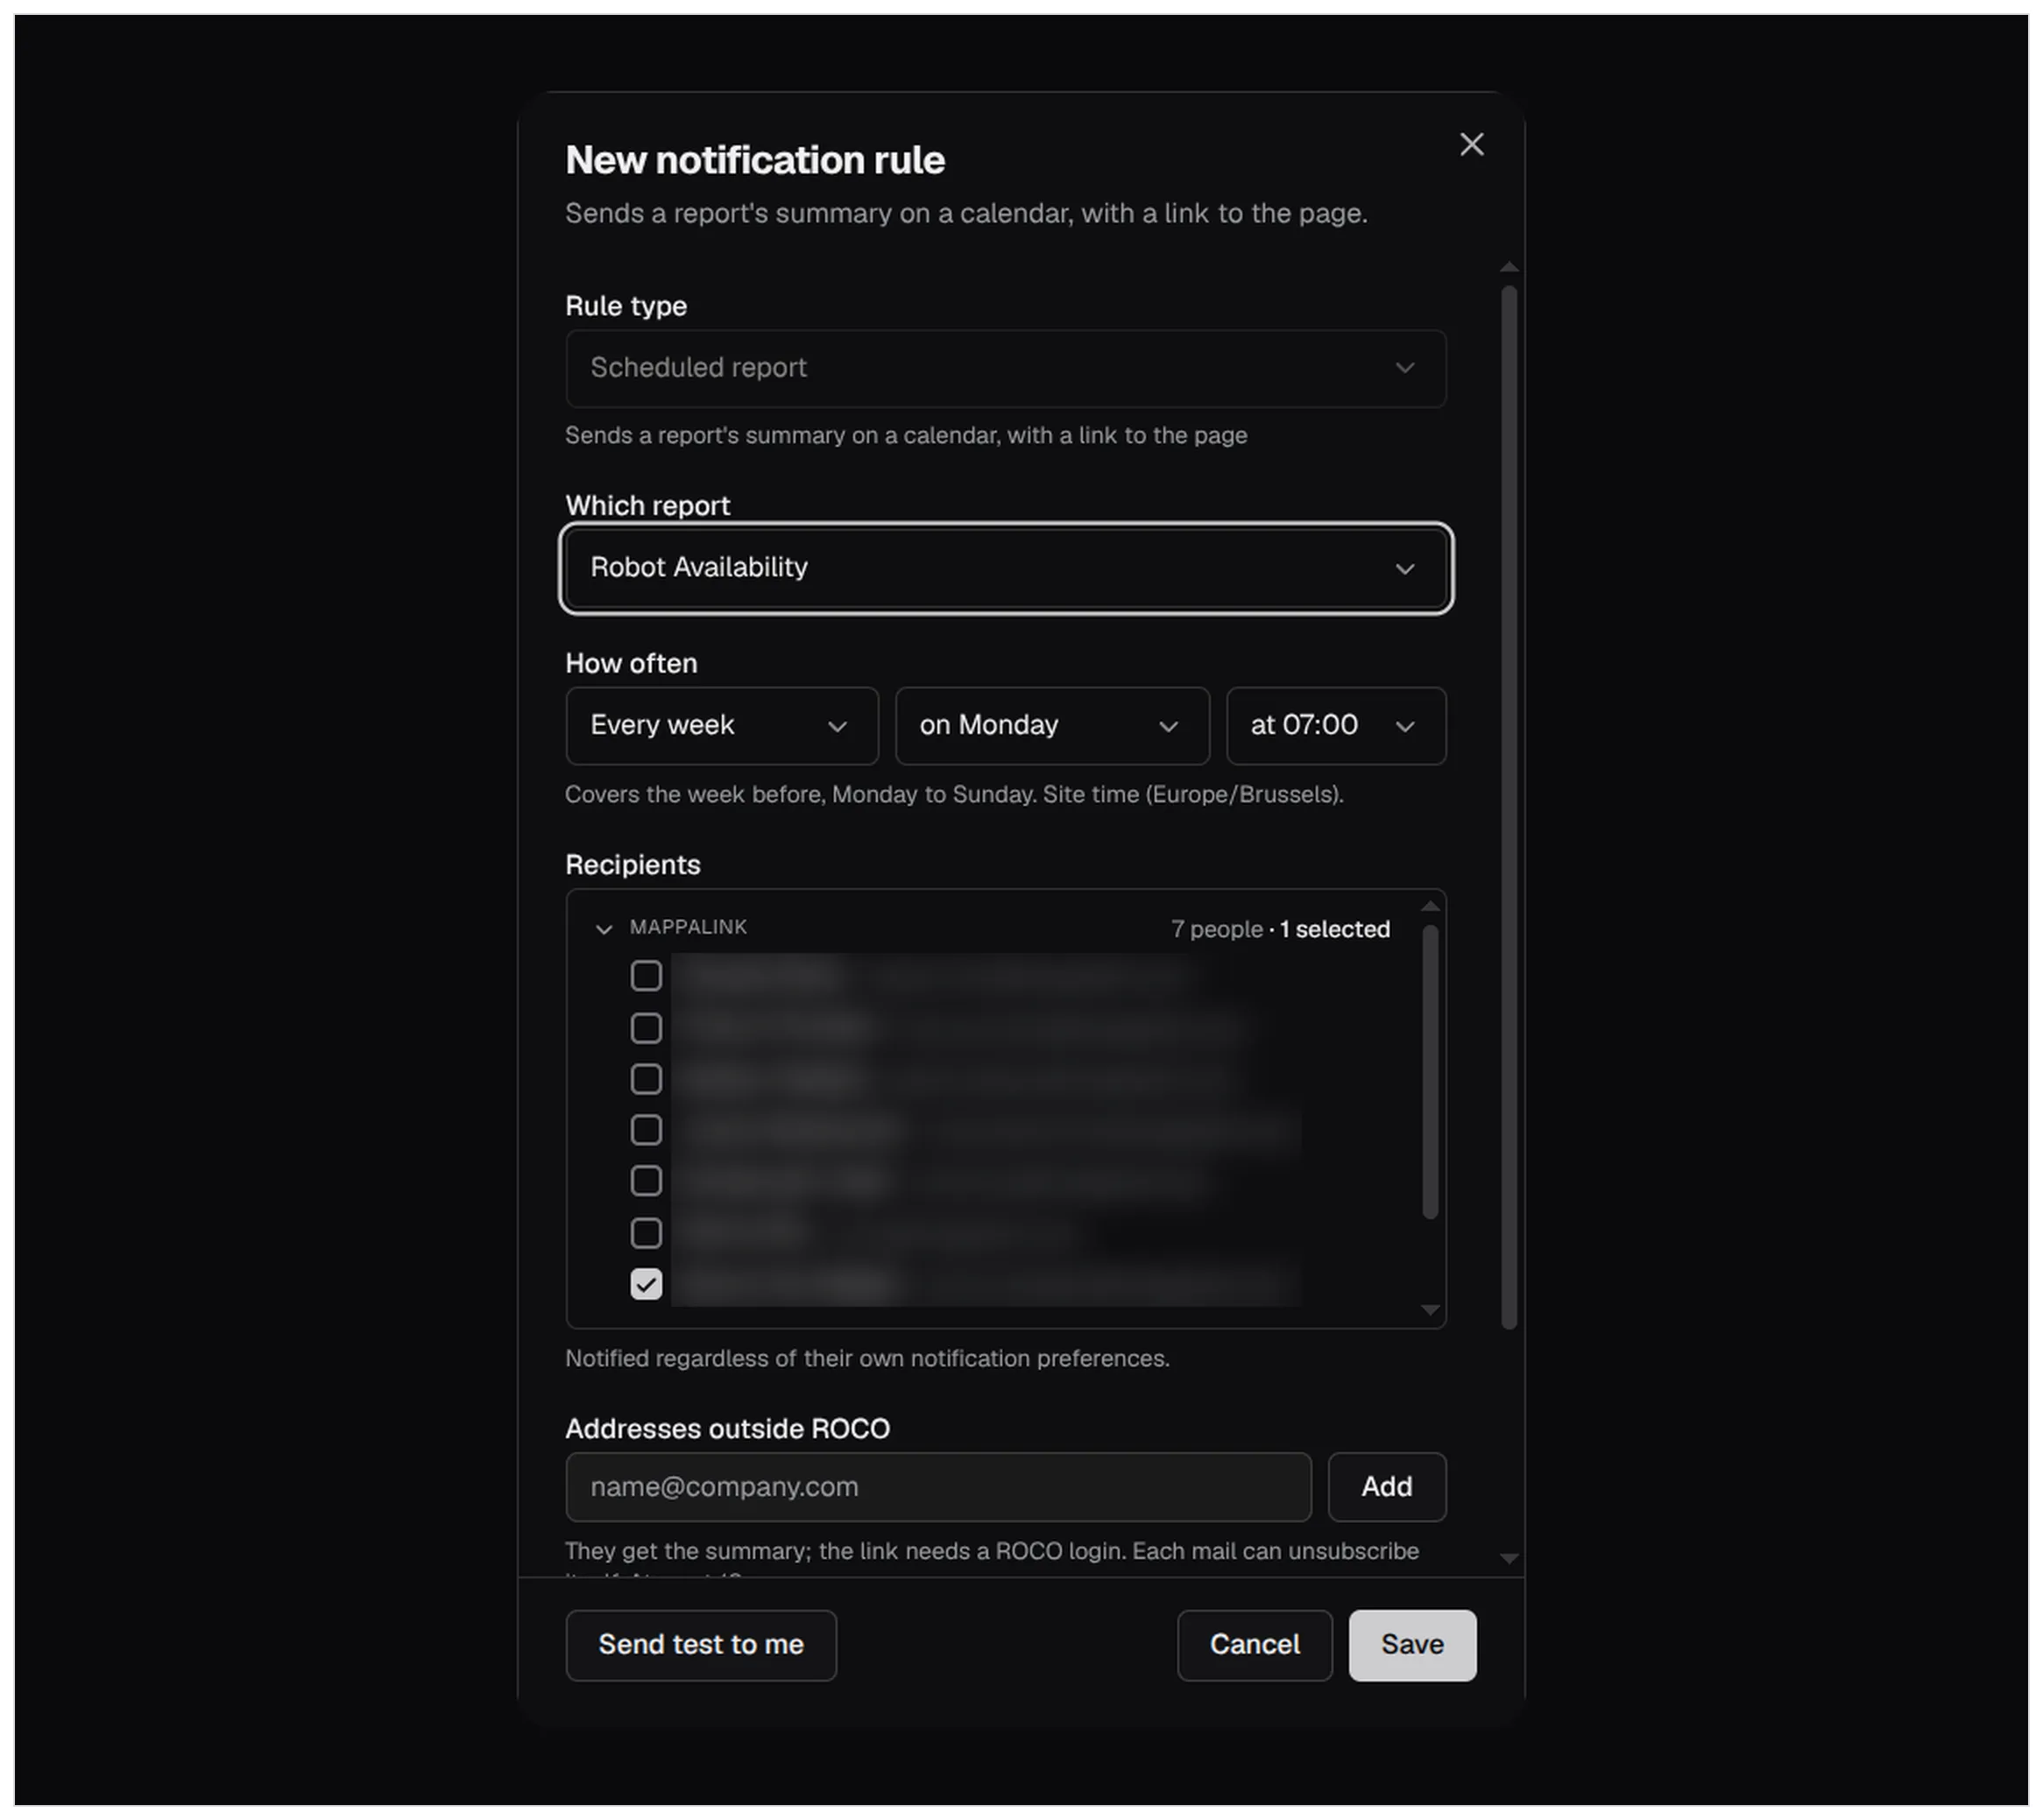
ROCO mails the people you pick when something needs them: a robot has been offline past your threshold, an action turns urgent, or a tracking zone reaches its limit.
New in October, Robot Availability can arrive on a schedule too: every day, week, month or quarter, each time covering the last complete period. You can add up to 10 addresses outside ROCO; they get the summary, and the link in it needs a ROCO login.