ROCO feature updates - September 2026
Senne Van Baelen2 min read
In September we worked on ROCO telling you what matters: which robot needs attention before it stops again, where your fleet’s time really goes, and how the last shift went, without opening a dashboard.
Realtime actions to gain productivity
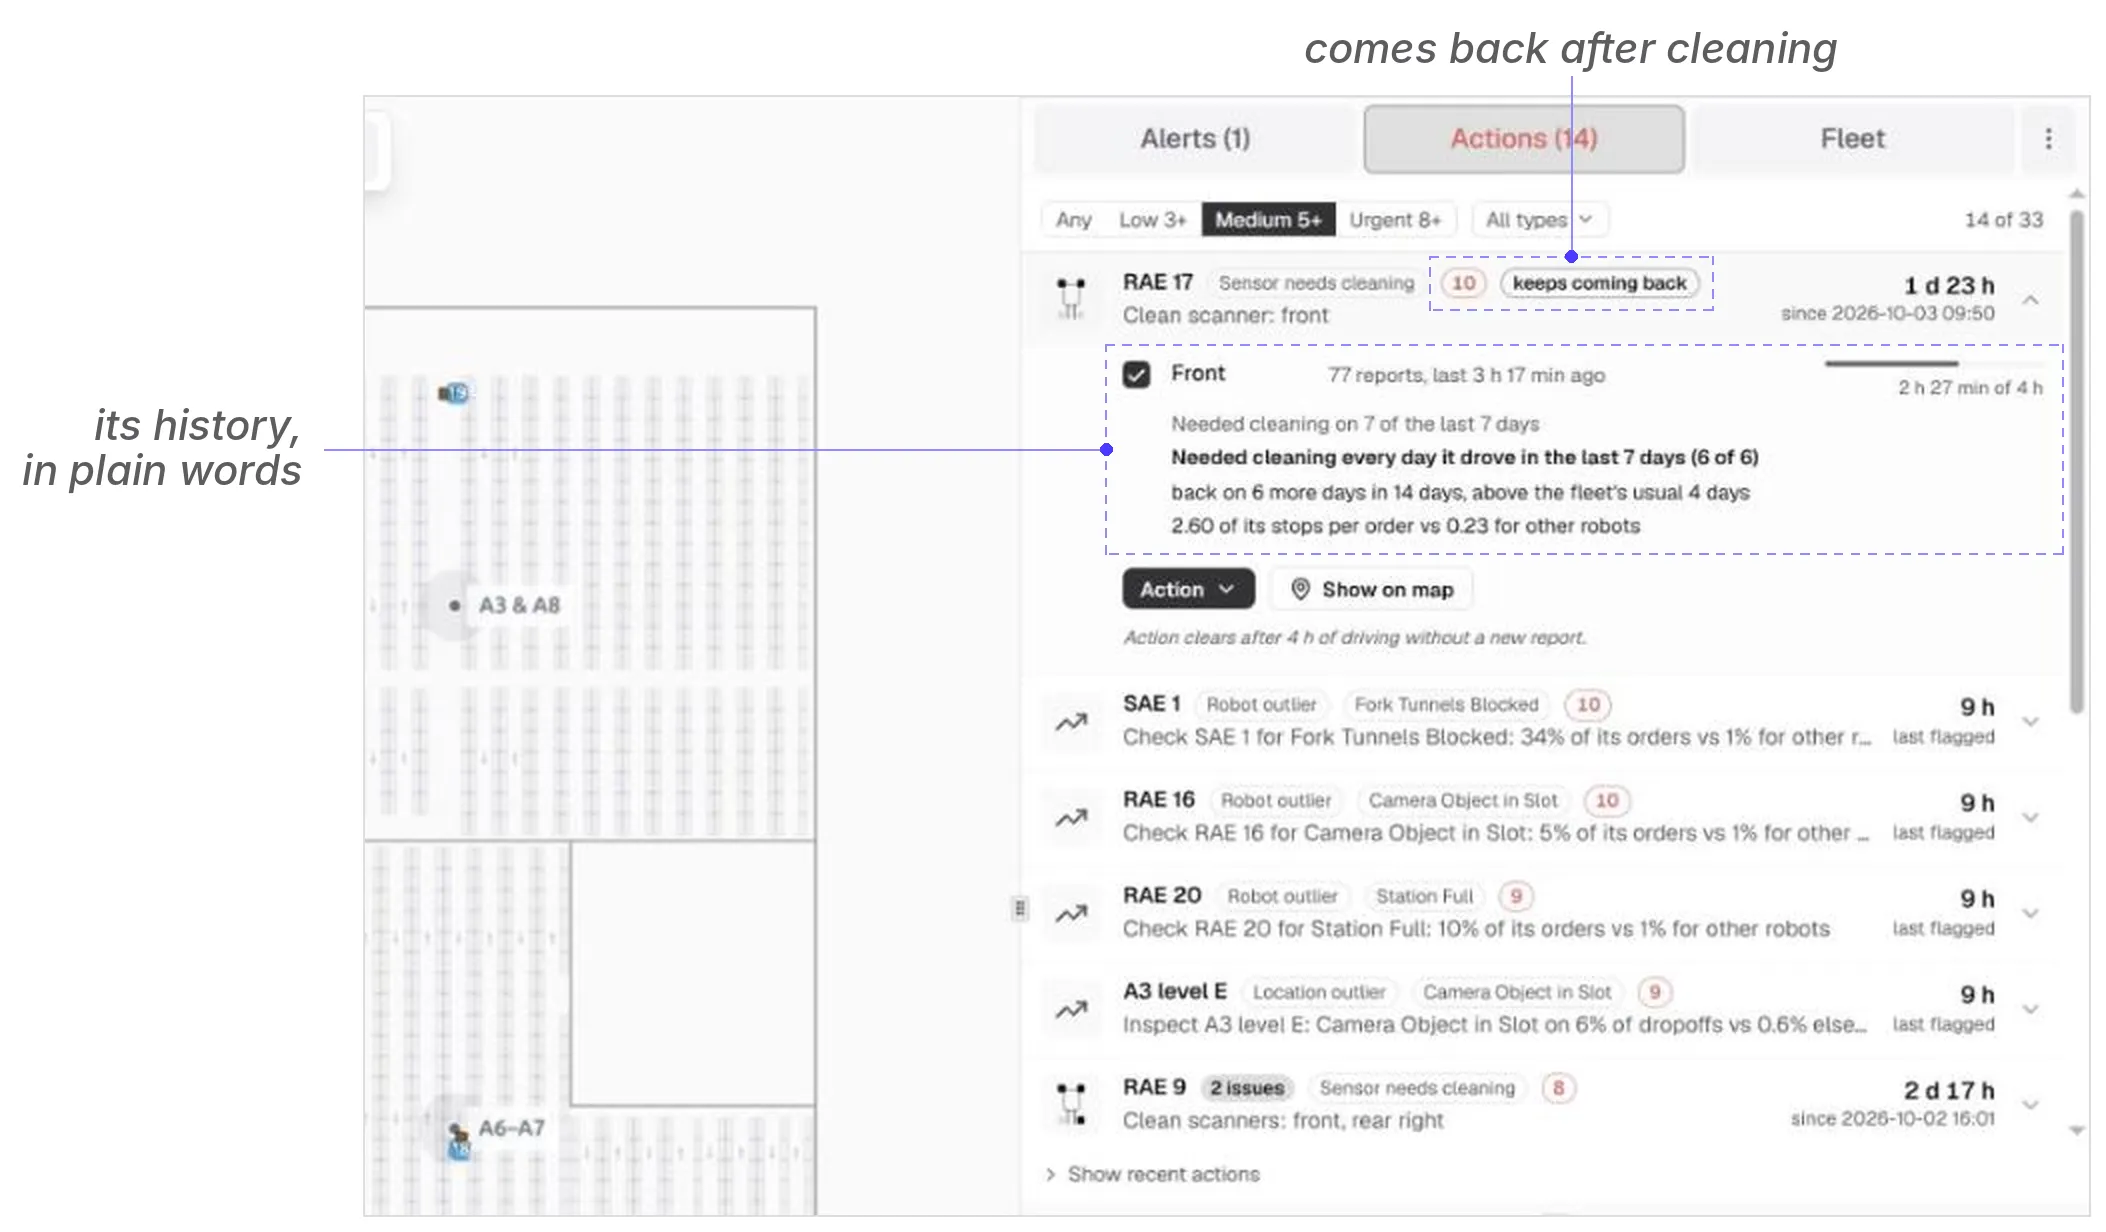
ROCO now lists everything your robots need, from a scanner to clean to a sensor to check, with an urgency from 0 to 10. When a robot needs the same scanner cleaned day after day, ROCO tags it so you can fix the cause. Tick the robots, then create a ticket or notify the right people.
One inbox for everything ROCO sends you
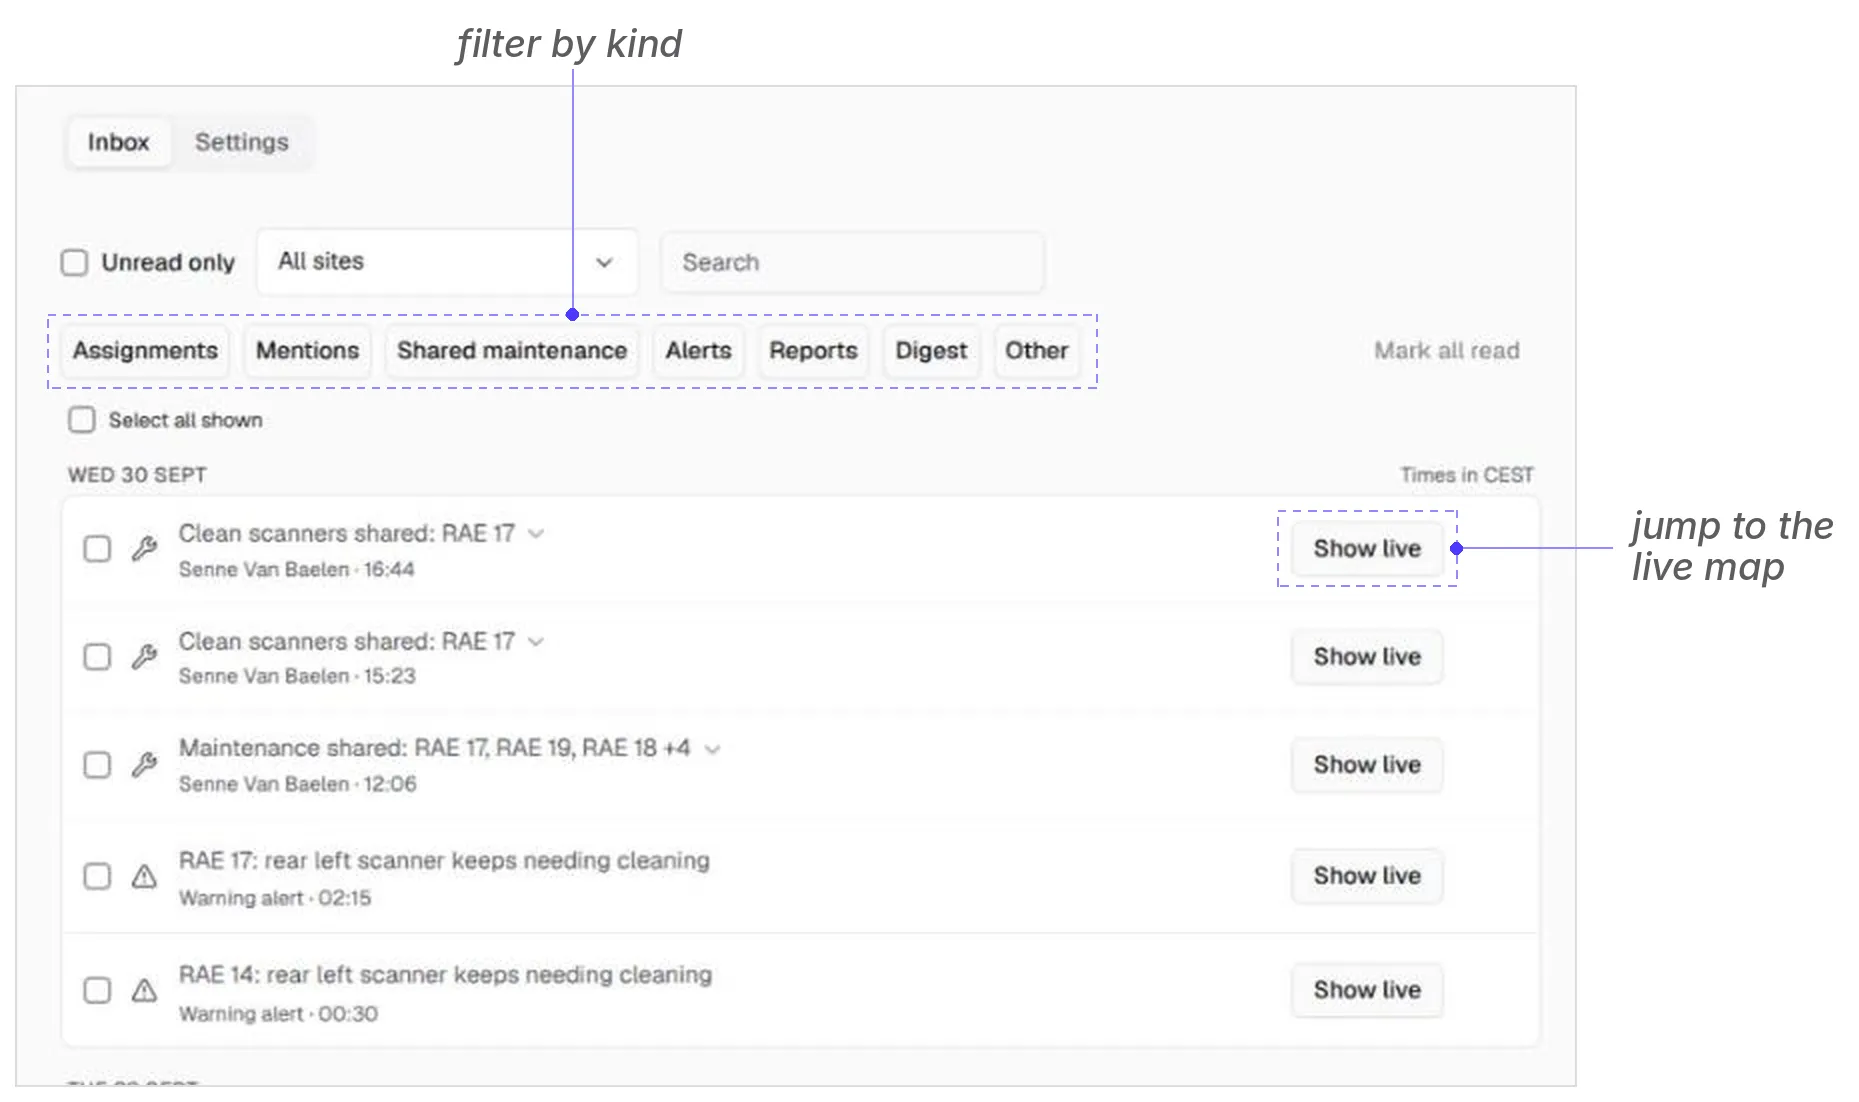
Alerts, shift reports, mentions and maintenance a colleague shared with you now land on one Notifications page, for all your sites. Filter by kind or site, and jump from any entry straight to the robot on the live map.
Robot availability, robot by robot
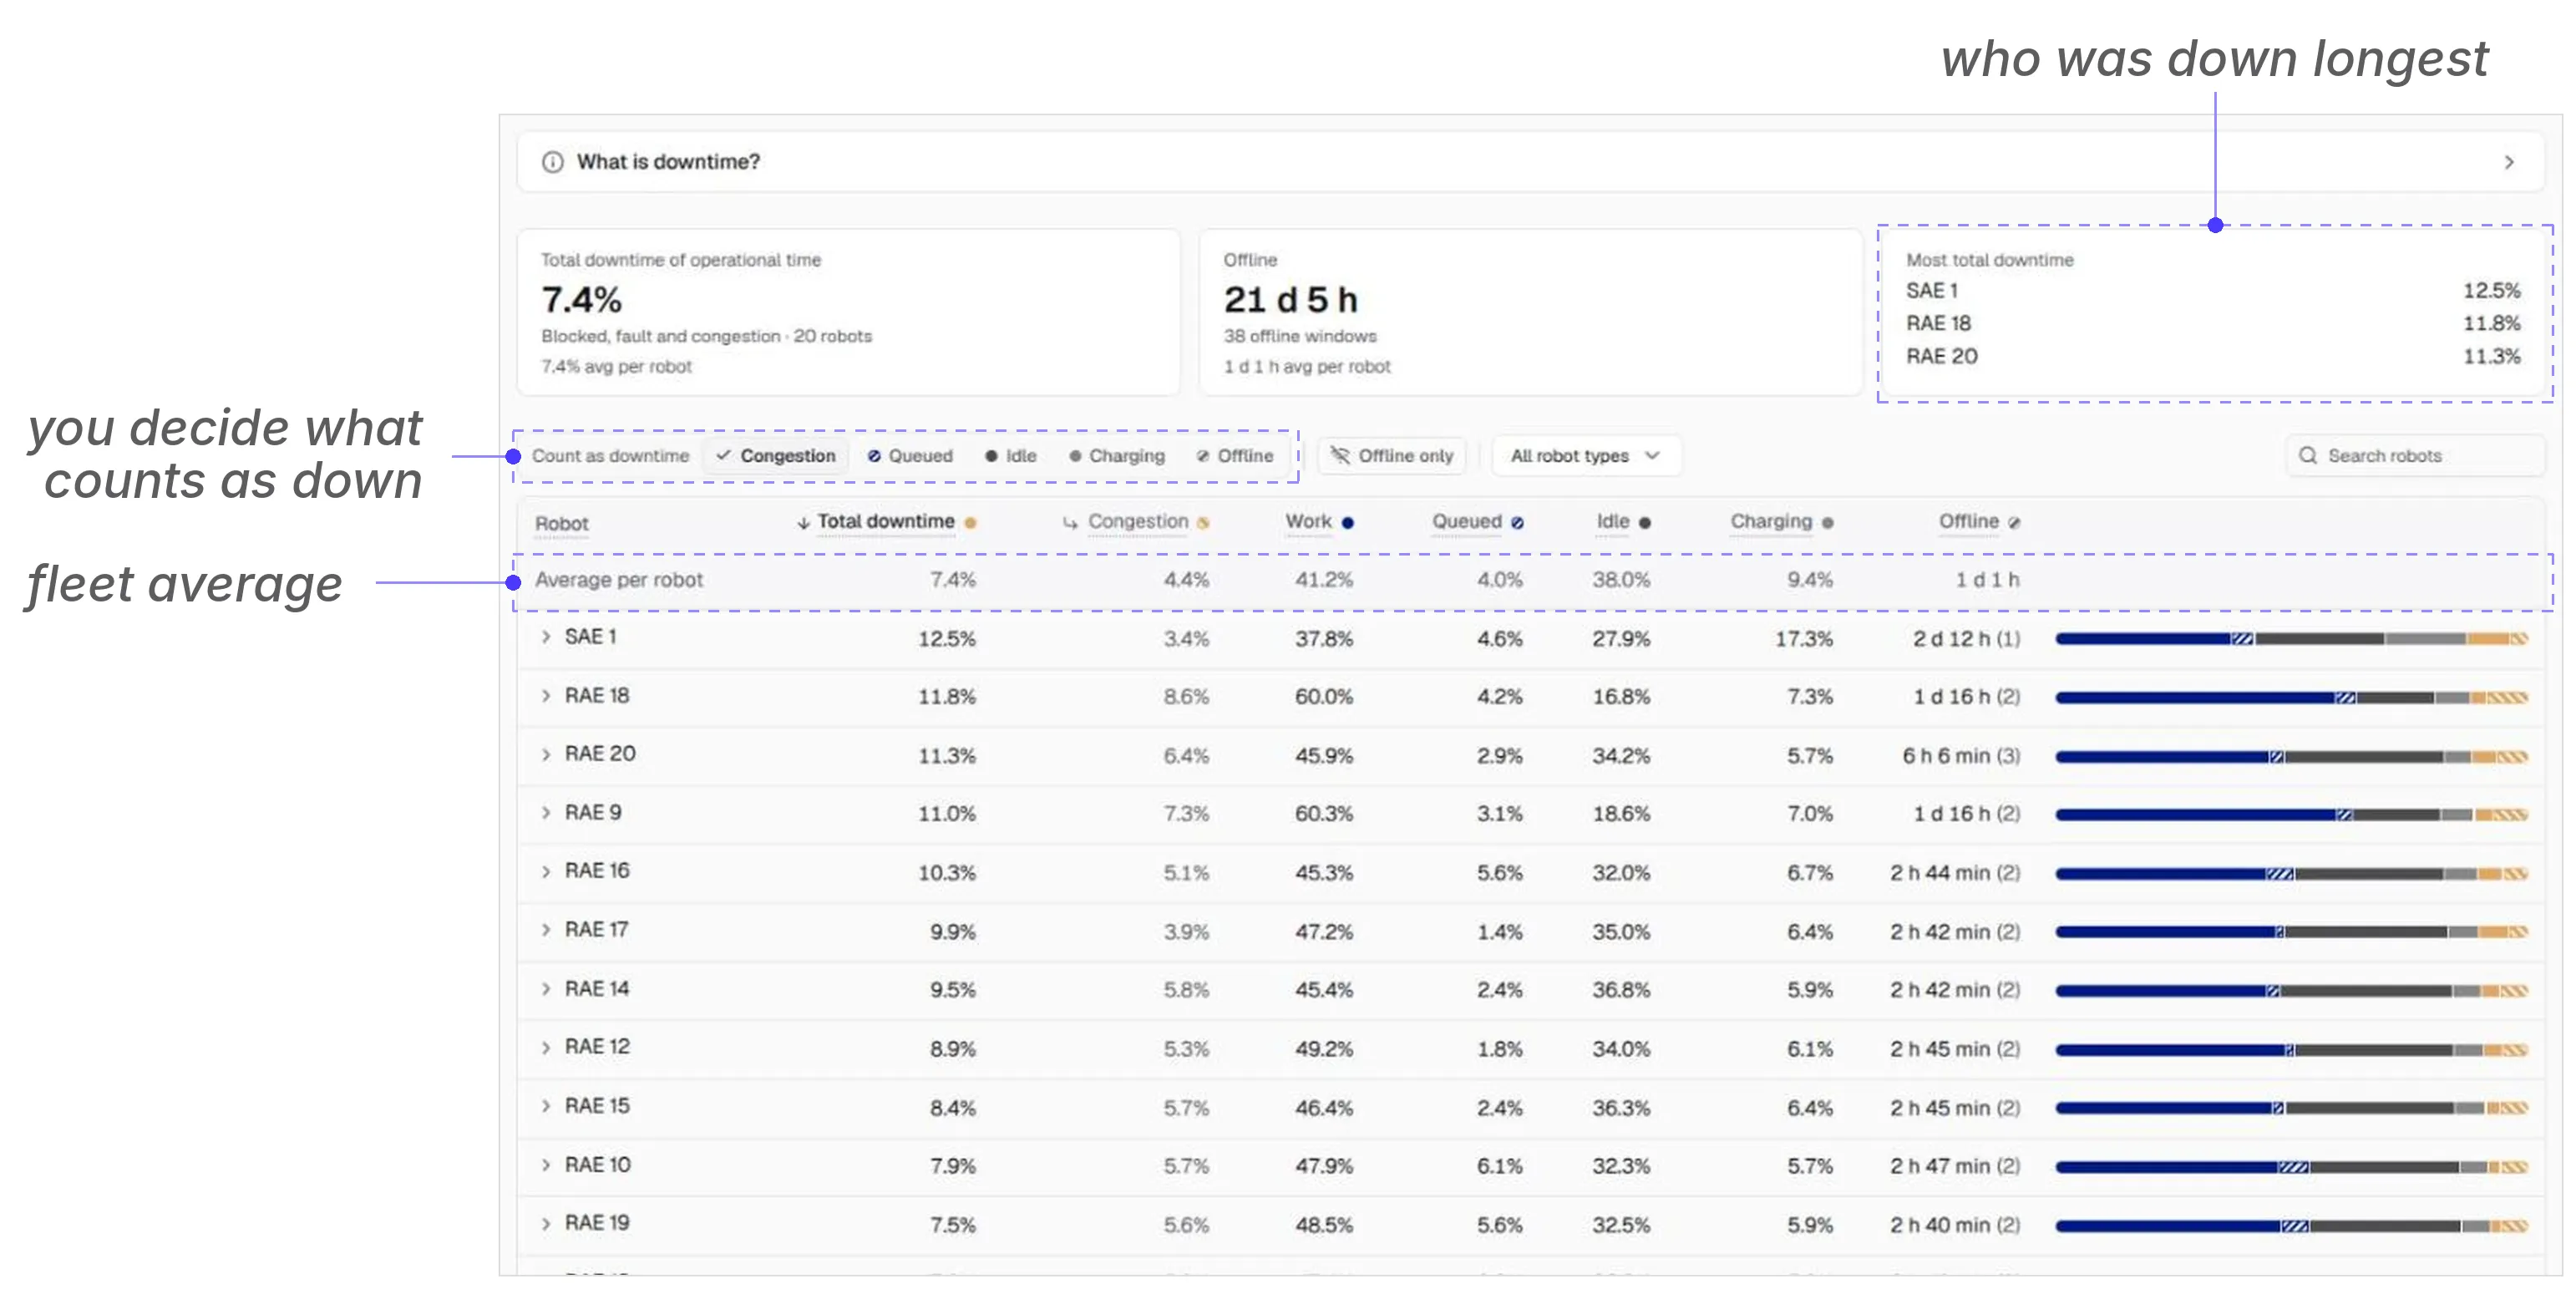
See how long each robot worked, waited, charged or was down, for any day, week, month or year. You decide what counts as downtime: some sites count a robot waiting in a queue as lost time, others don’t. Every robot is set against the fleet average, and opening one shows exactly when it was offline. What counts as downtime, and why: What is robot downtime?
See which customers and order flows cause the most stops
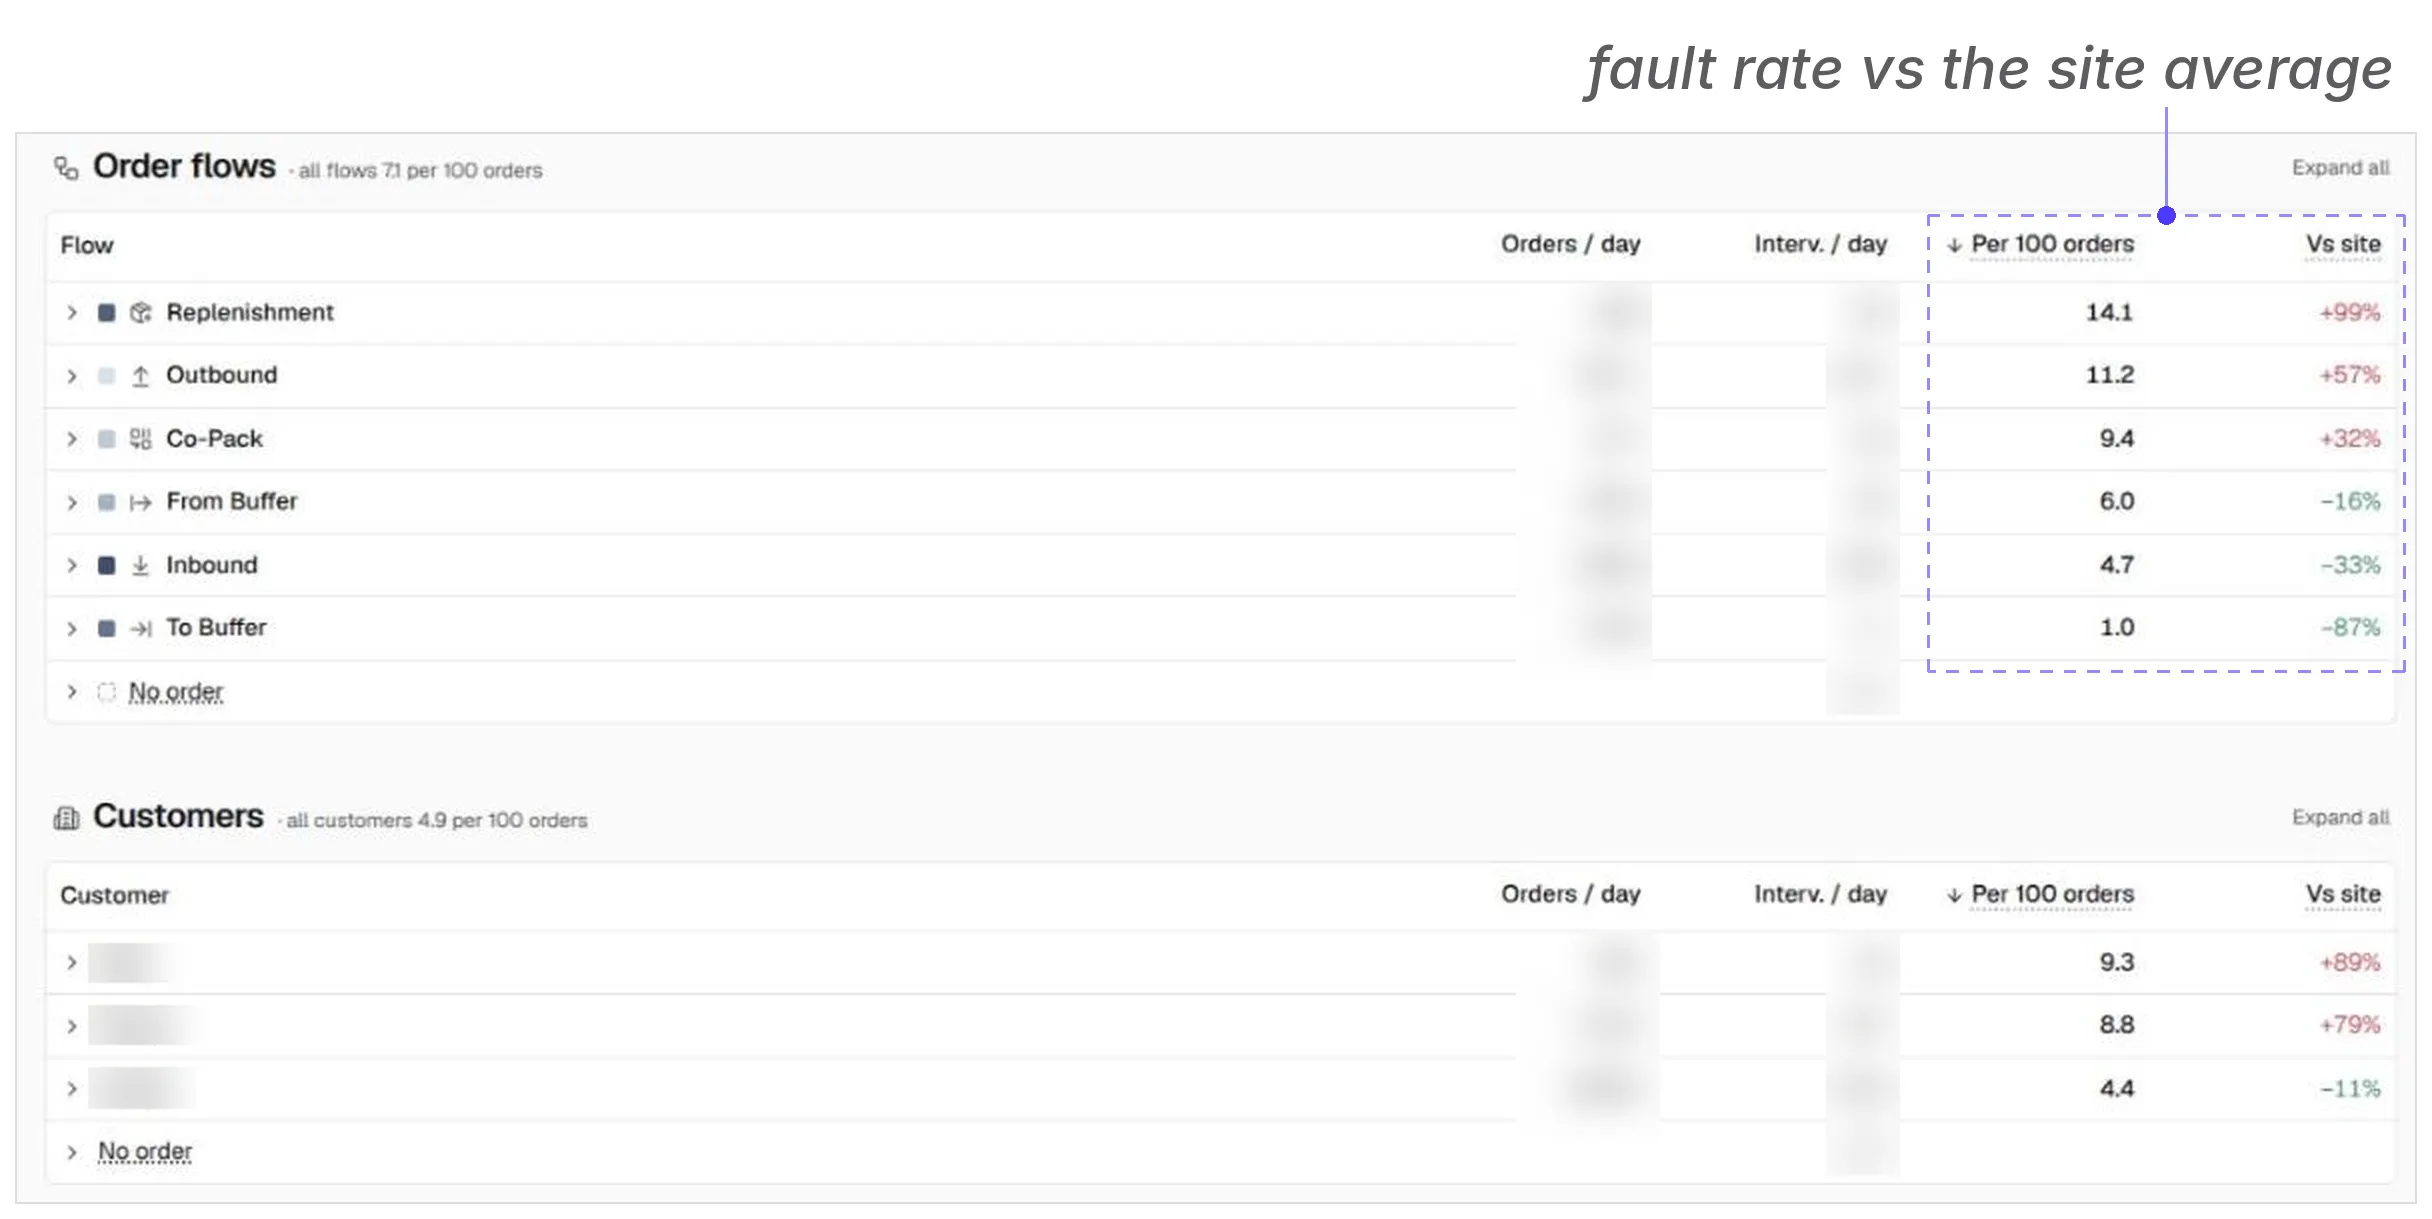
A busy flow will always have more interventions than a quiet one. ROCO now shows interventions per 100 orders for every order flow and every customer, next to the site average, so you see which ones really cause trouble. Open a row for its top causes.
Tracking zones: a report for any area you draw
Draw an area on your warehouse map, such as a busy cross aisle, and choose which incidents count. ROCO gives it its own report: how many incidents this period compared with the last, what caused them and which robots were involved. It can also warn you when a threshold is crossed.
Shift reports and alerts in your mailbox
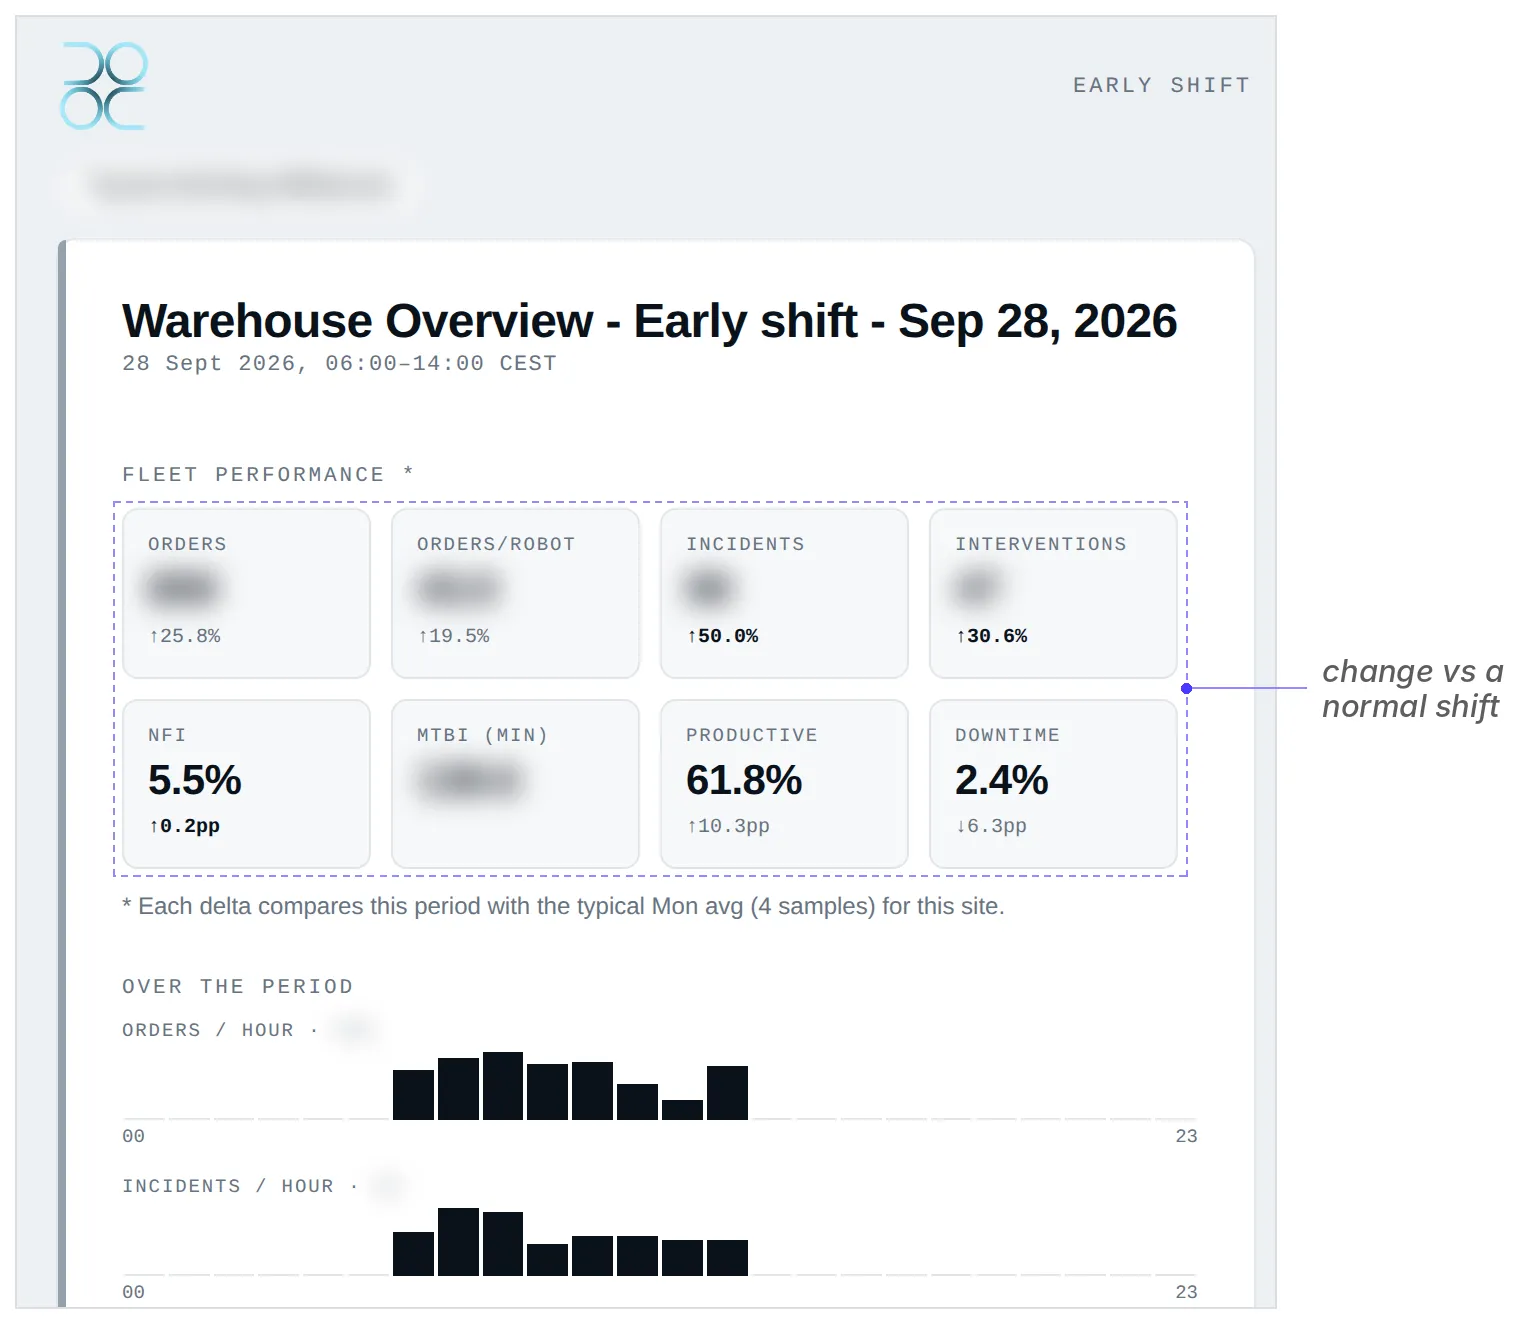
When a shift, daily, weekly or monthly report is ready, ROCO emails the headline numbers, each compared with a normal shift at your site. Alerts work the same way: when robots stay offline too long, the people you name get an email, and a second one once it’s resolved.